Threat Intelligence
A vulnerability that is being exploited this week is not the same as one that merely has a CVSS score. Threat Intelligence keeps a current picture of what attackers are actually using — known-exploited CVEs, live C2 servers, phishing and malware URLs, botnet infrastructure — and connects it to your findings and assets, so exploitability, not just severity, decides what your team fixes first.
Where: left navigation → Threat & Intelligence → Threat Intelligence.
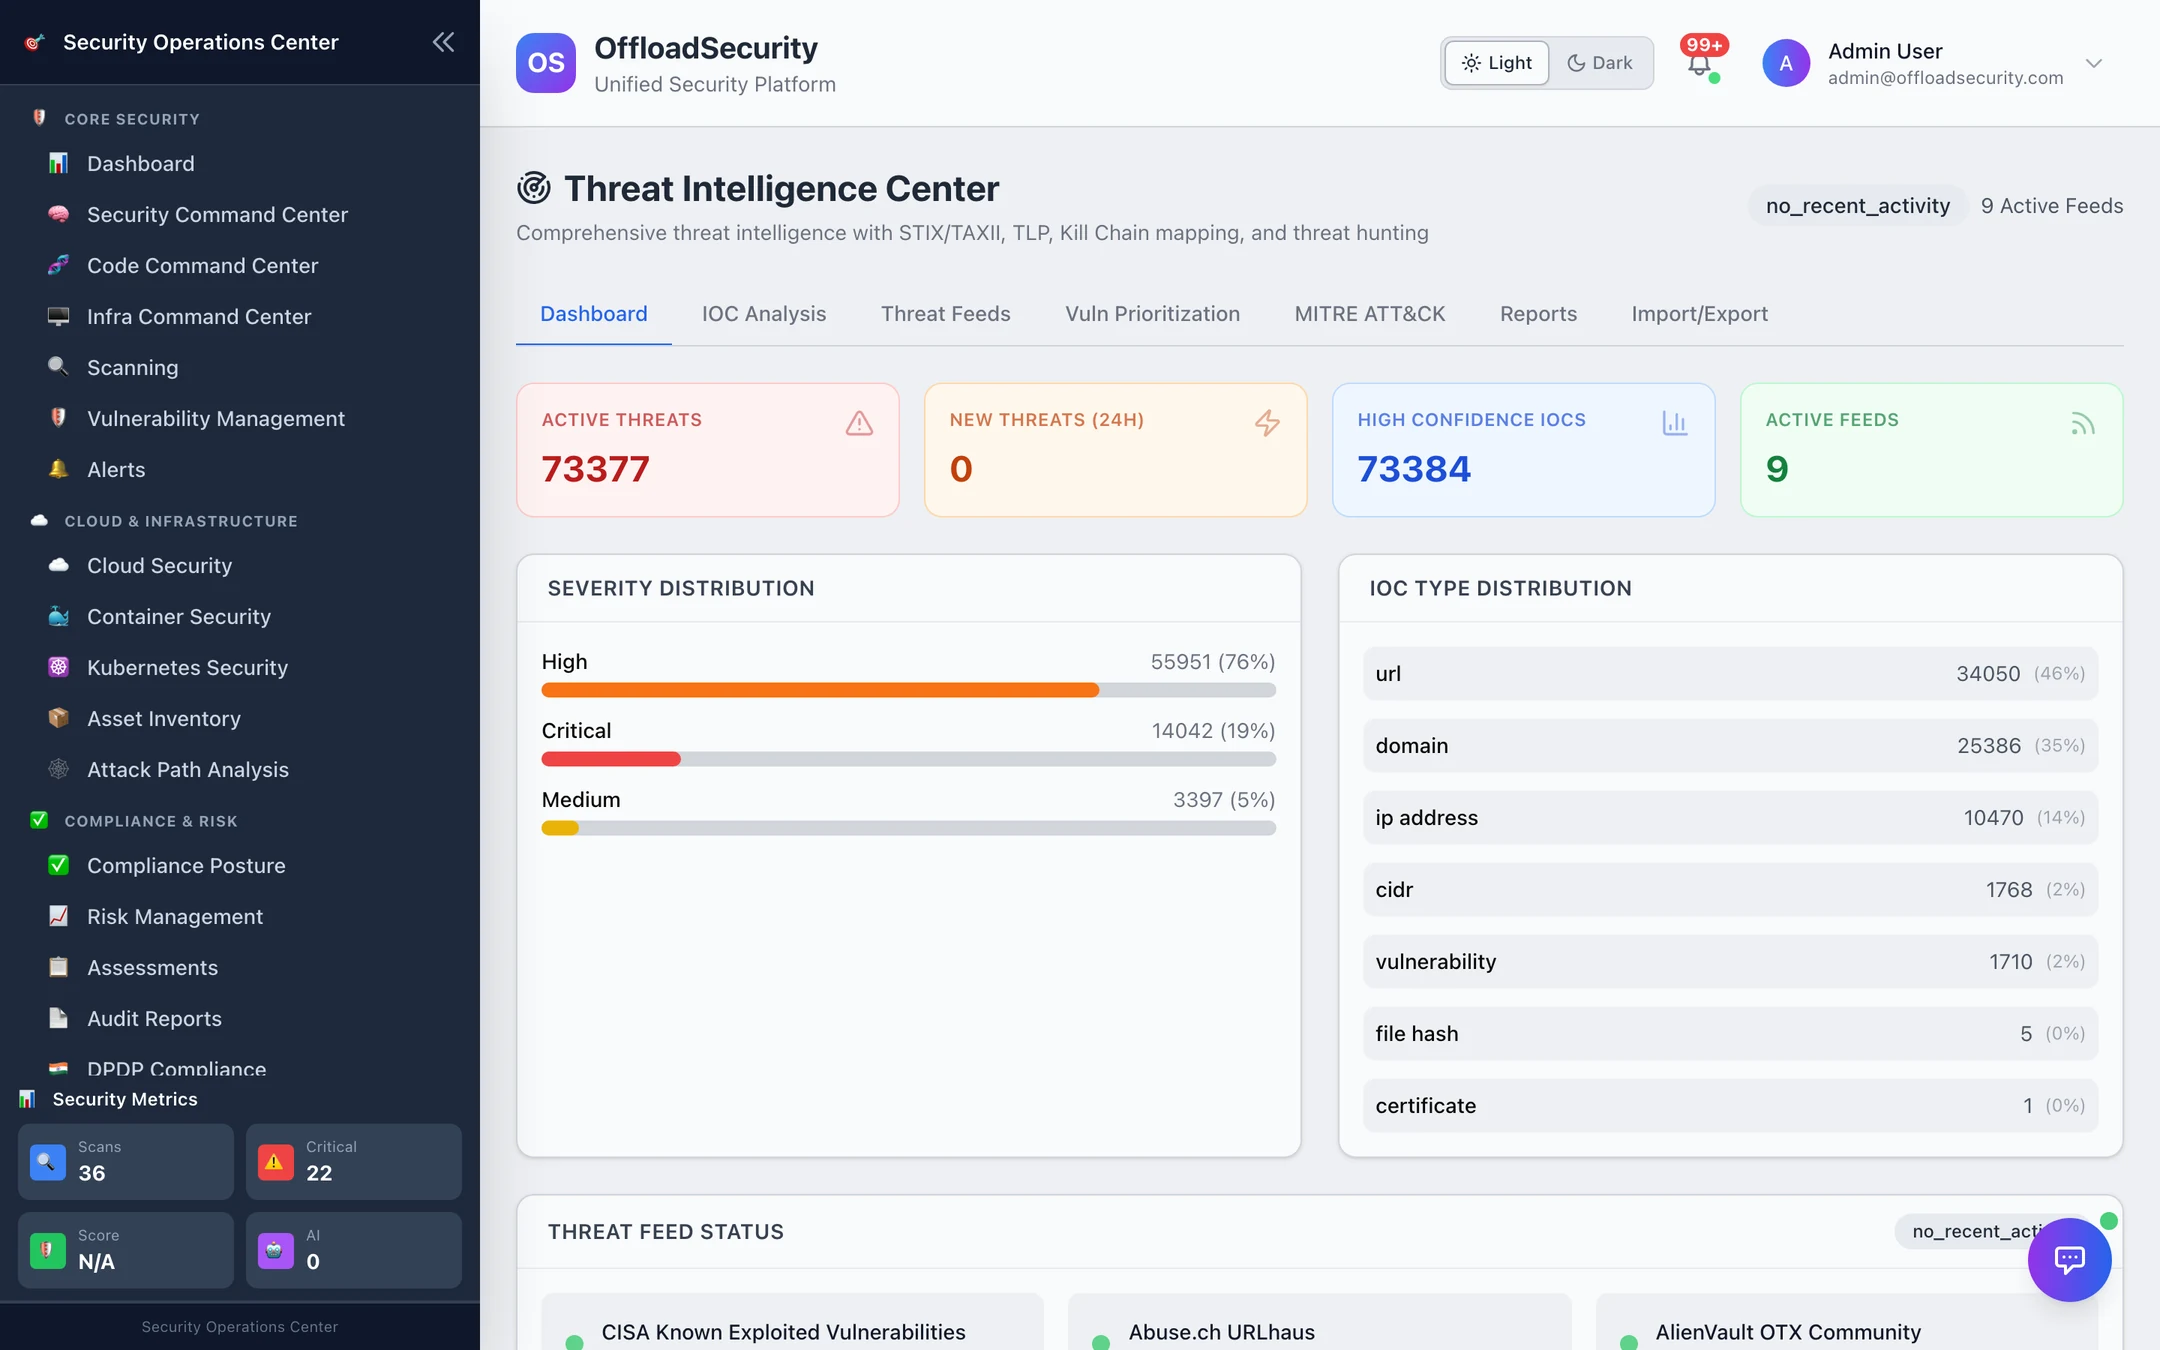
Dashboard
Headline counts — active threats, new in the last 24 hours, high-confidence IOCs, active feeds — then the severity mix, the indicator-type mix (URL, domain, IP address, CIDR, vulnerability, file hash, certificate) and a status card per feed. Active means not expired: indicators carry a time-to-live and age out (see Import / export and indicator aging), so the dashboard reflects current intelligence rather than everything ever fetched.
Threat feeds
Nine feeds ship with the platform, enabled per team. Every enabled feed is fetched hourly; Process Feed Now fetches one immediately.
| Feed | What it contributes | Key |
|---|---|---|
| CISA Known Exploited Vulnerabilities | CVEs confirmed exploited in the wild — the strongest single prioritisation signal | — |
| Abuse.ch URLhaus | Malware distribution URLs | Auth-Key required |
| AlienVault OTX Community | Community pulses: IPs, domains, hashes with context | API key required |
| Feodo Tracker (abuse.ch) | Botnet C2 servers (Emotet, Dridex, QakBot…) | optional |
| SSL Blacklist (abuse.ch) | Certificates and IPs used by malware C2 | optional |
| PhishTank | Verified phishing URLs | — |
| Blocklist.de | IPs reported for attacks on SSH, mail, web | — |
| Spamhaus DROP | Hijacked / criminal netblocks (CIDR) | — |
| OpenPhish | Phishing URLs | — |
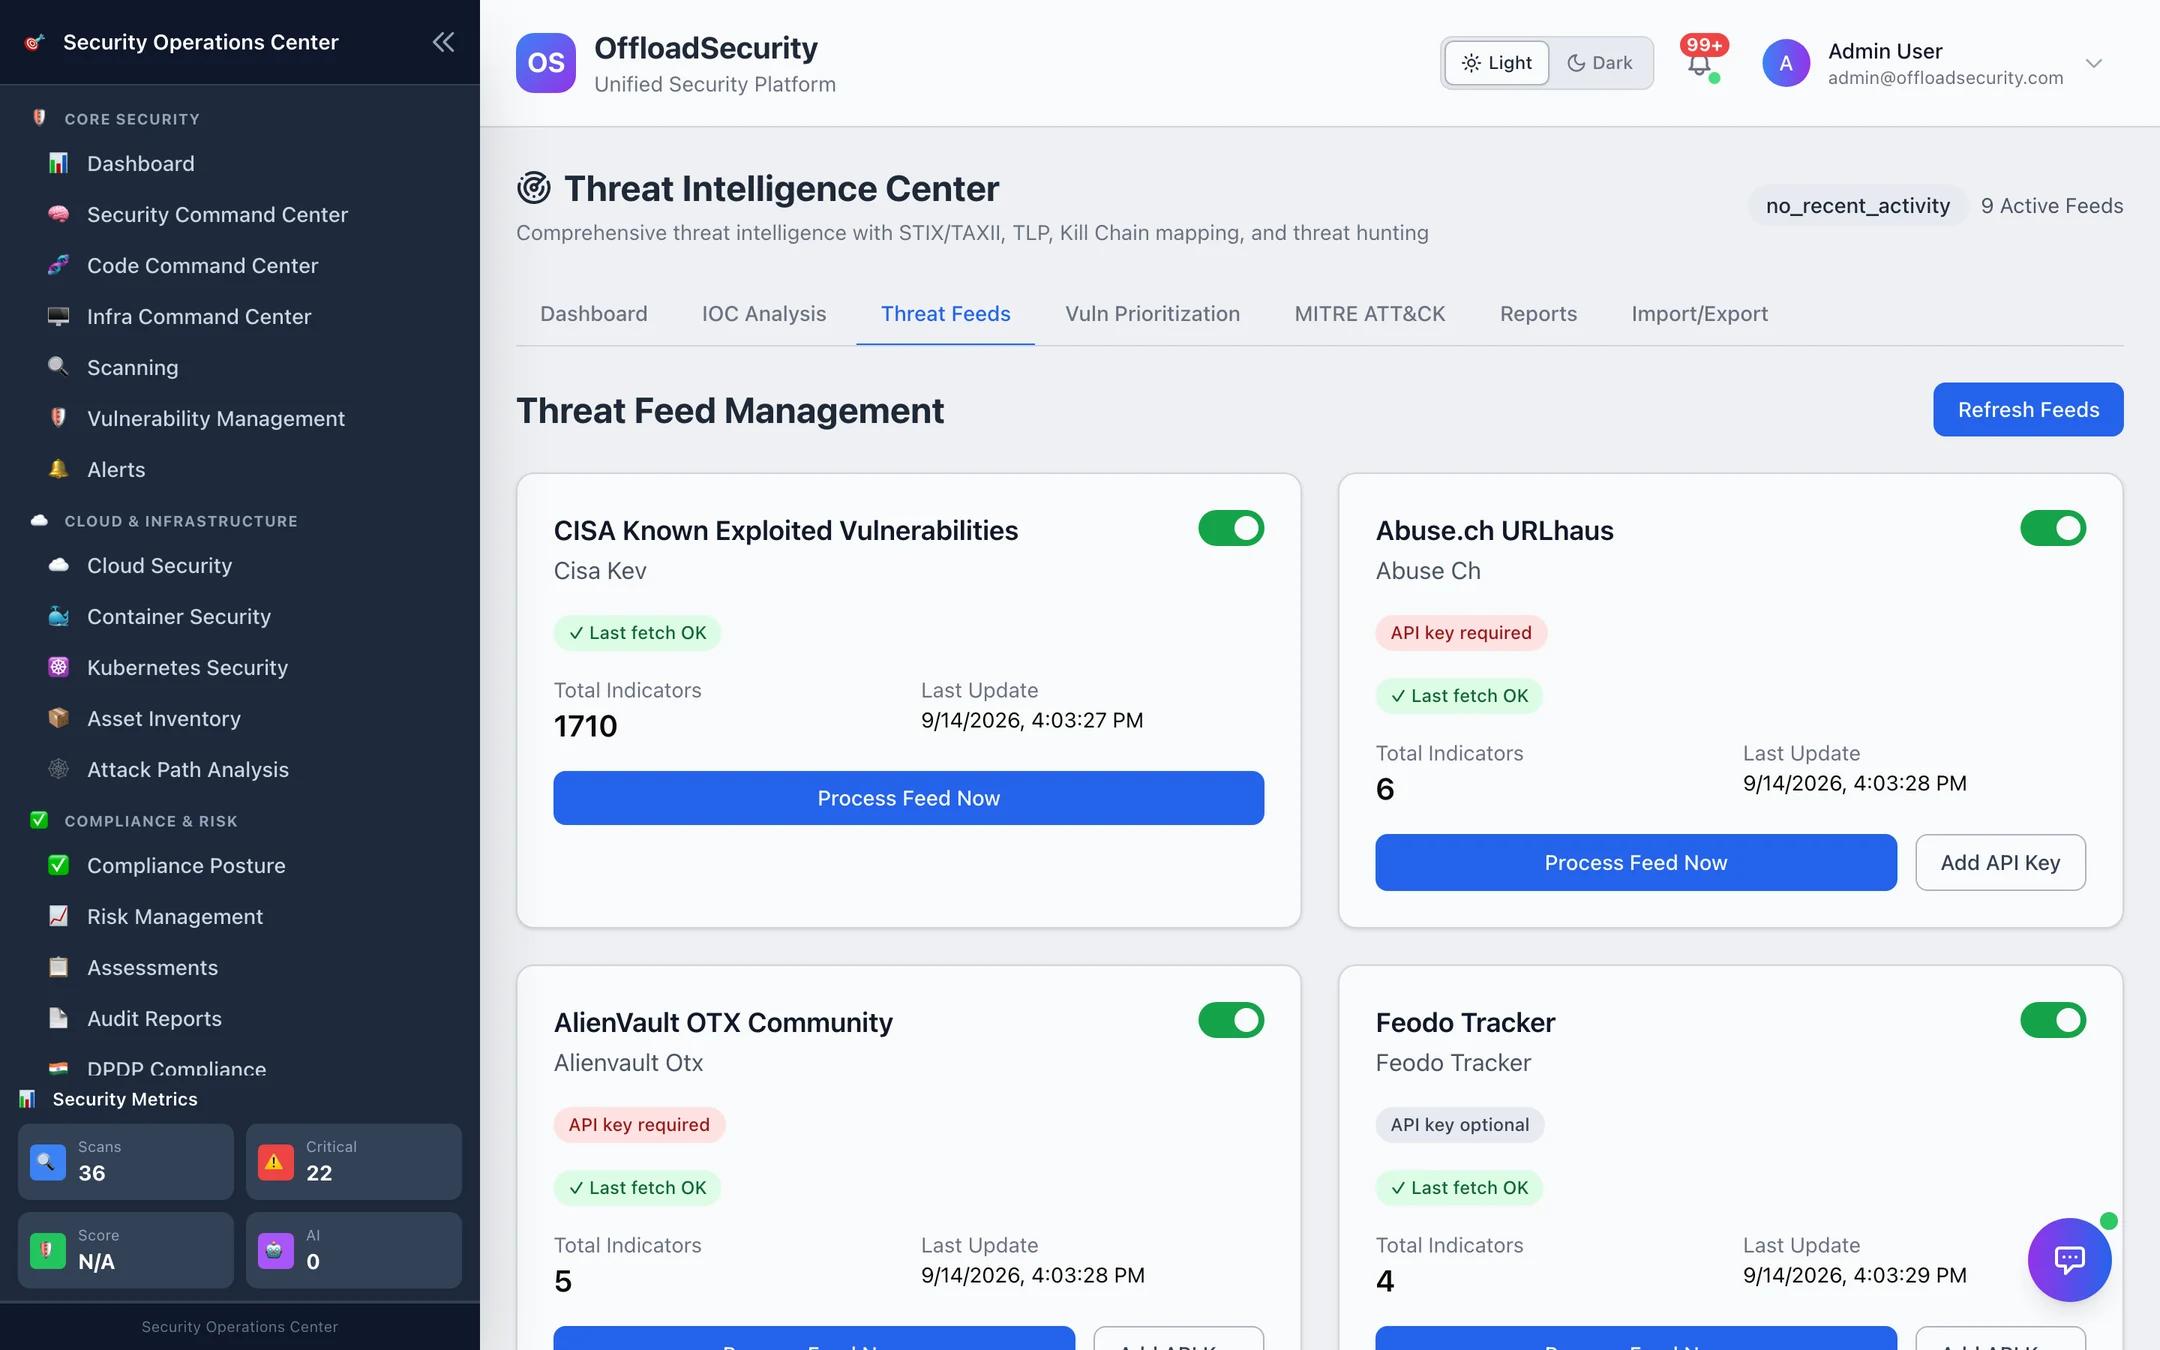
Each card shows the last fetch result, the indicator count and, where the source needs one, Add API Key (stored encrypted, per team). Feed health is recalculated every six hours from recent fetch outcomes — healthy, degraded, critical — and a failing feed is classified — authentication, rate-limited, quota, timeout, unreachable, parse error, discontinued — so the card says what to fix (a transient class is retried automatically). Disable a feed and its indicators stop refreshing; they age out on their normal schedule.
It needs no key, it is small (about 1,700 CVEs), and it feeds every prioritisation path in the platform — the CVE priority score below, the Triage engine's exploitability signal, and the Command Center's Critical verdicts.
IOC analysis
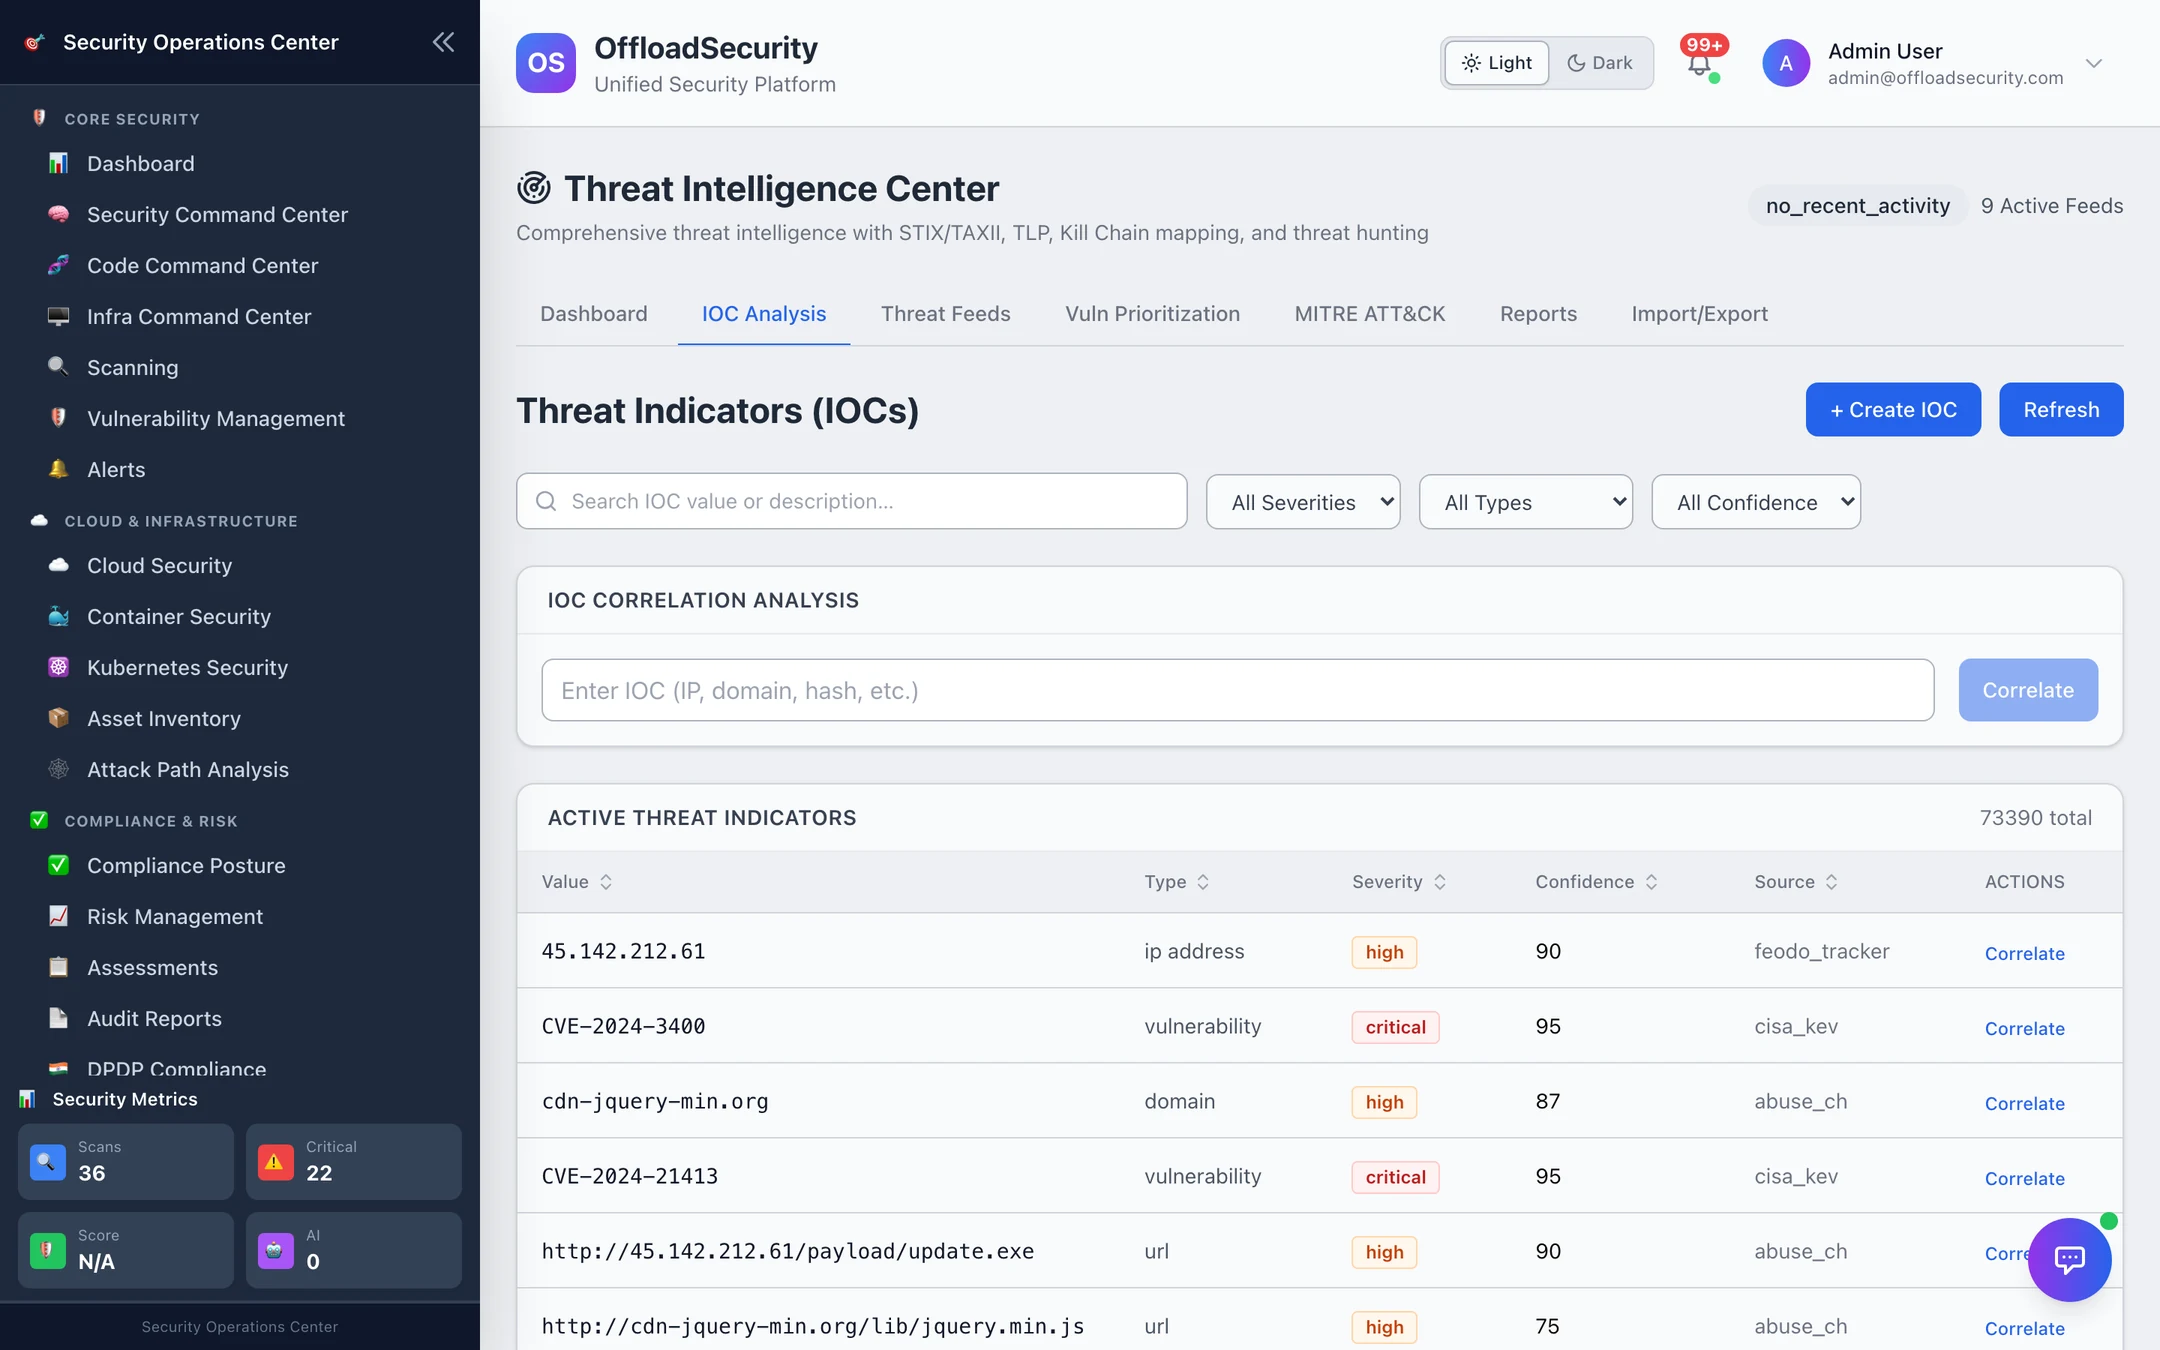
Every indicator from every feed in one table: value, type, severity, confidence (0–100), source feed. Search by value or description; filter by severity, type or confidence. + Create IOC adds your own indicator (type — IP, domain, URL, file hash, email, certificate, registry key, user agent, cryptocurrency address, YARA rule — value, severity, description) — from an incident, a partner, or a red-team exercise — and it is treated like any feed indicator from then on.
Correlate (on a row, or any value typed into IOC Correlation Analysis) checks the indicator against what you run: matching assets in the inventory by IP, domain or hash, related indicators, and known actors and campaigns. A match is the strongest signal you have of active compromise and deserves an incident, not a ticket.
Vulnerability prioritisation
Vuln Prioritization takes a list of CVE ids and returns a threat priority score and an urgency for each, computed from the intelligence the team holds:
| Signal | Contribution |
|---|---|
| Base | 50 |
| Listed in CISA KEV | +25 |
| Related indicators (feeds referencing the CVE) | +5 each, up to +15 |
| Threat actors known to exploit it | +5 each, up to +10 |
| Active campaigns using it | +5 each, up to +10 |
| A related indicator rated critical | +10 |
Score ≥ 80 → critical, ≥ 60 → high, ≥ 40 → medium, else low; the result also states whether active exploitation is confirmed (KEV or a known actor) and recommends an action. The same KEV flag and EPSS probability are inputs to the Triage engine, which is why a KEV-listed high shows up above a non-KEV critical in the action queue.
MITRE ATT&CK
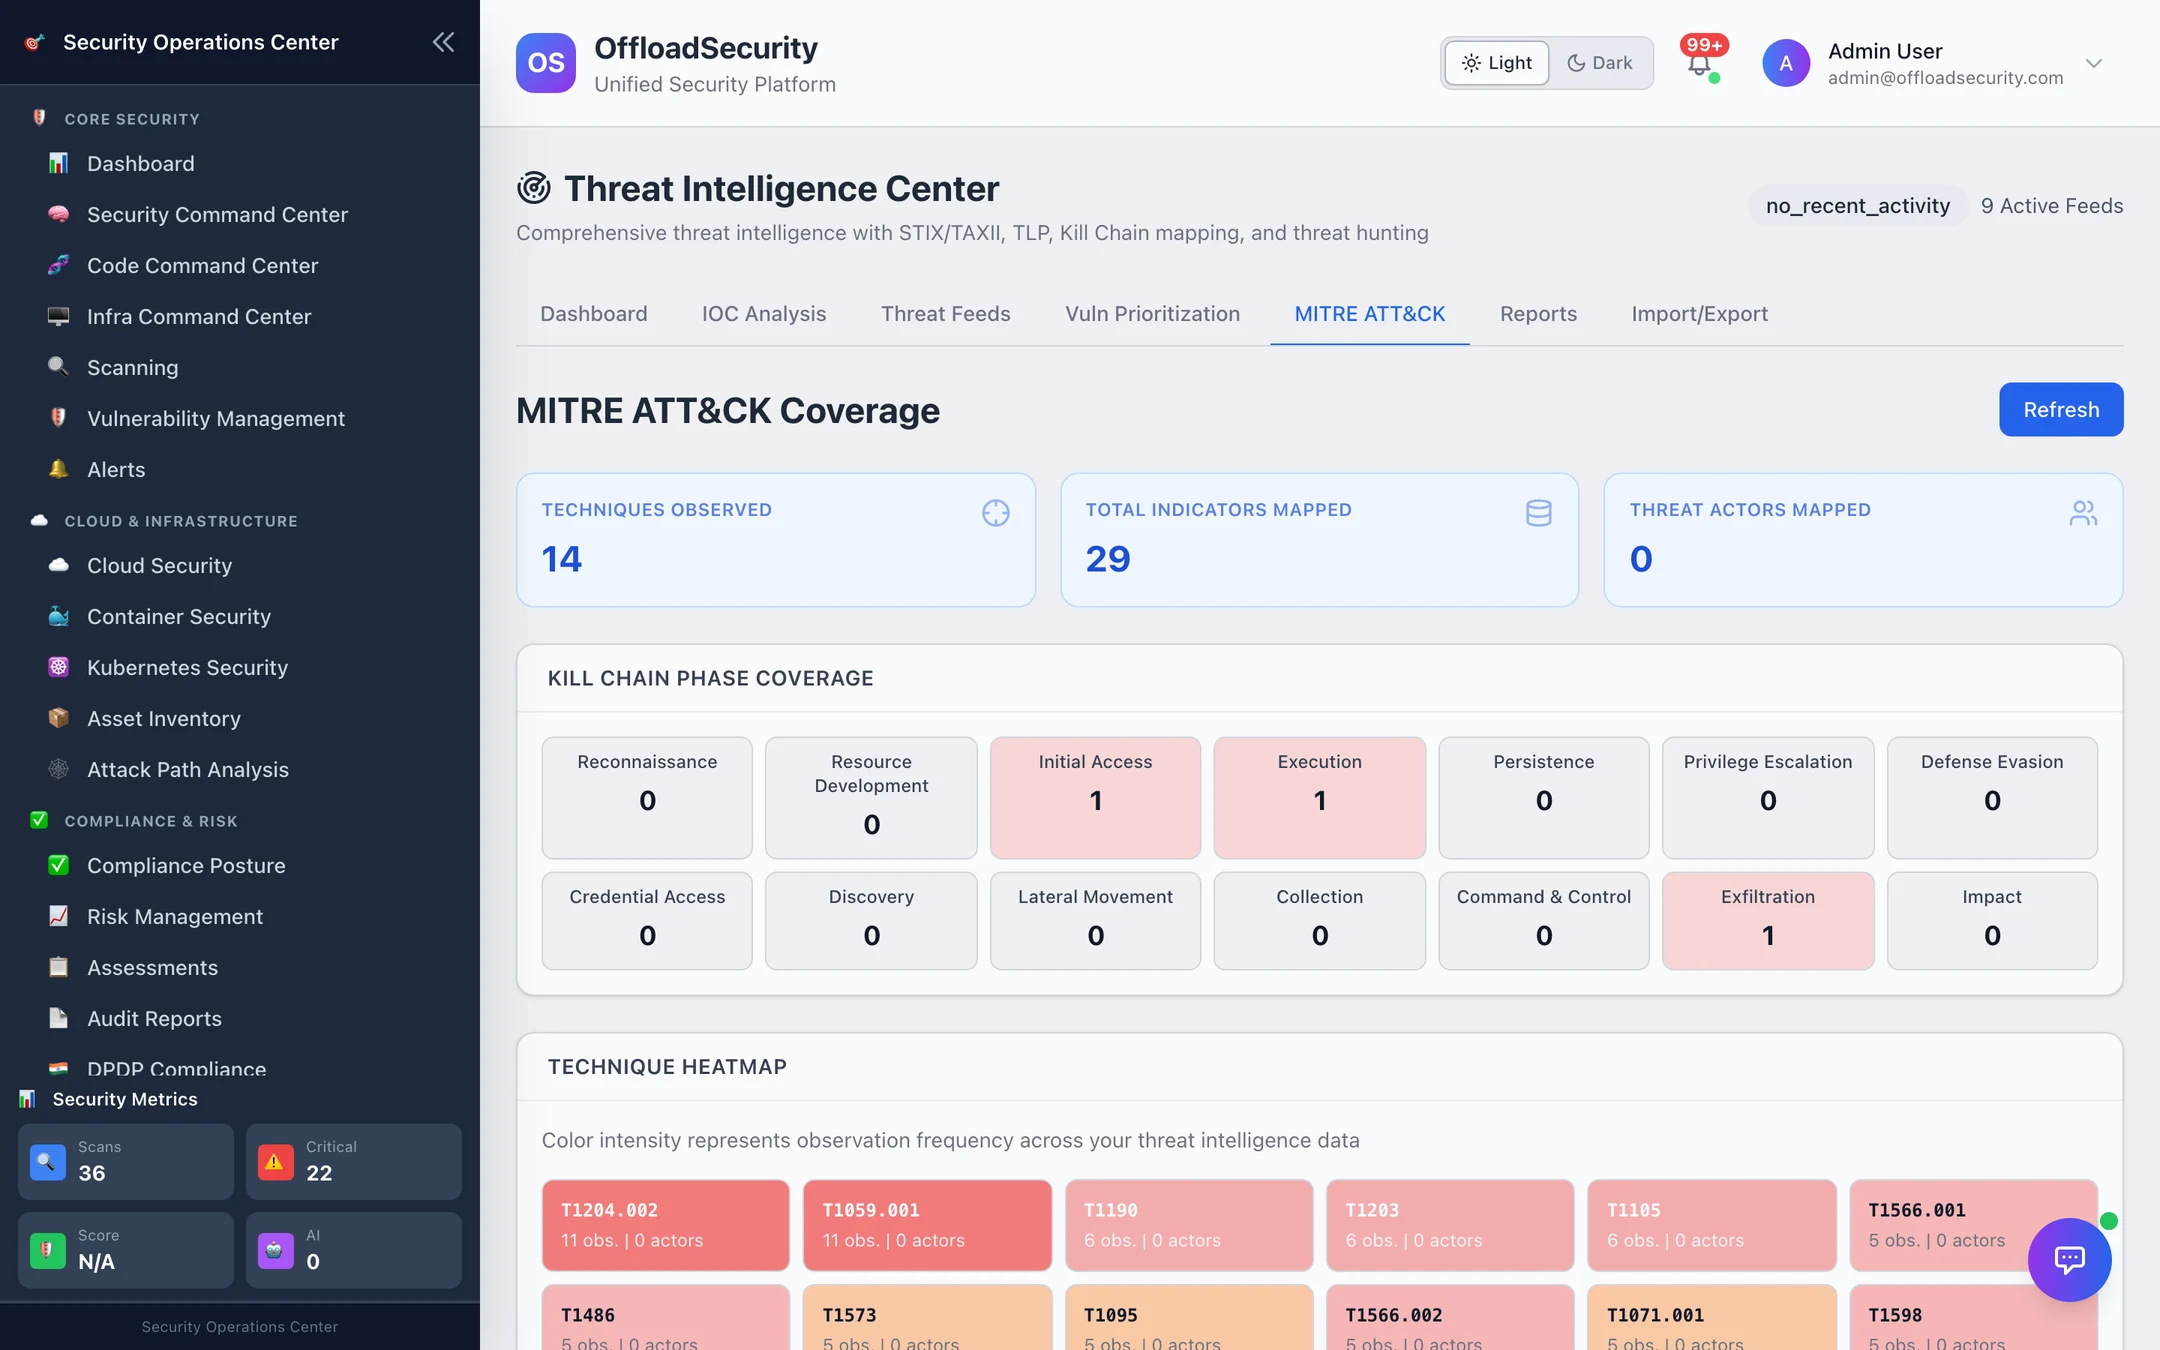
Indicators that carry technique ids (from feeds, actors and campaigns) are aggregated into a technique heatmap — darker means more observations — and a kill-chain phase view (Reconnaissance → Impact) that shows where the intelligence you hold concentrates. It is a map of observed threat activity, not of your defensive coverage: an empty phase means nothing in your feeds maps there, not that you are protected.
Reports
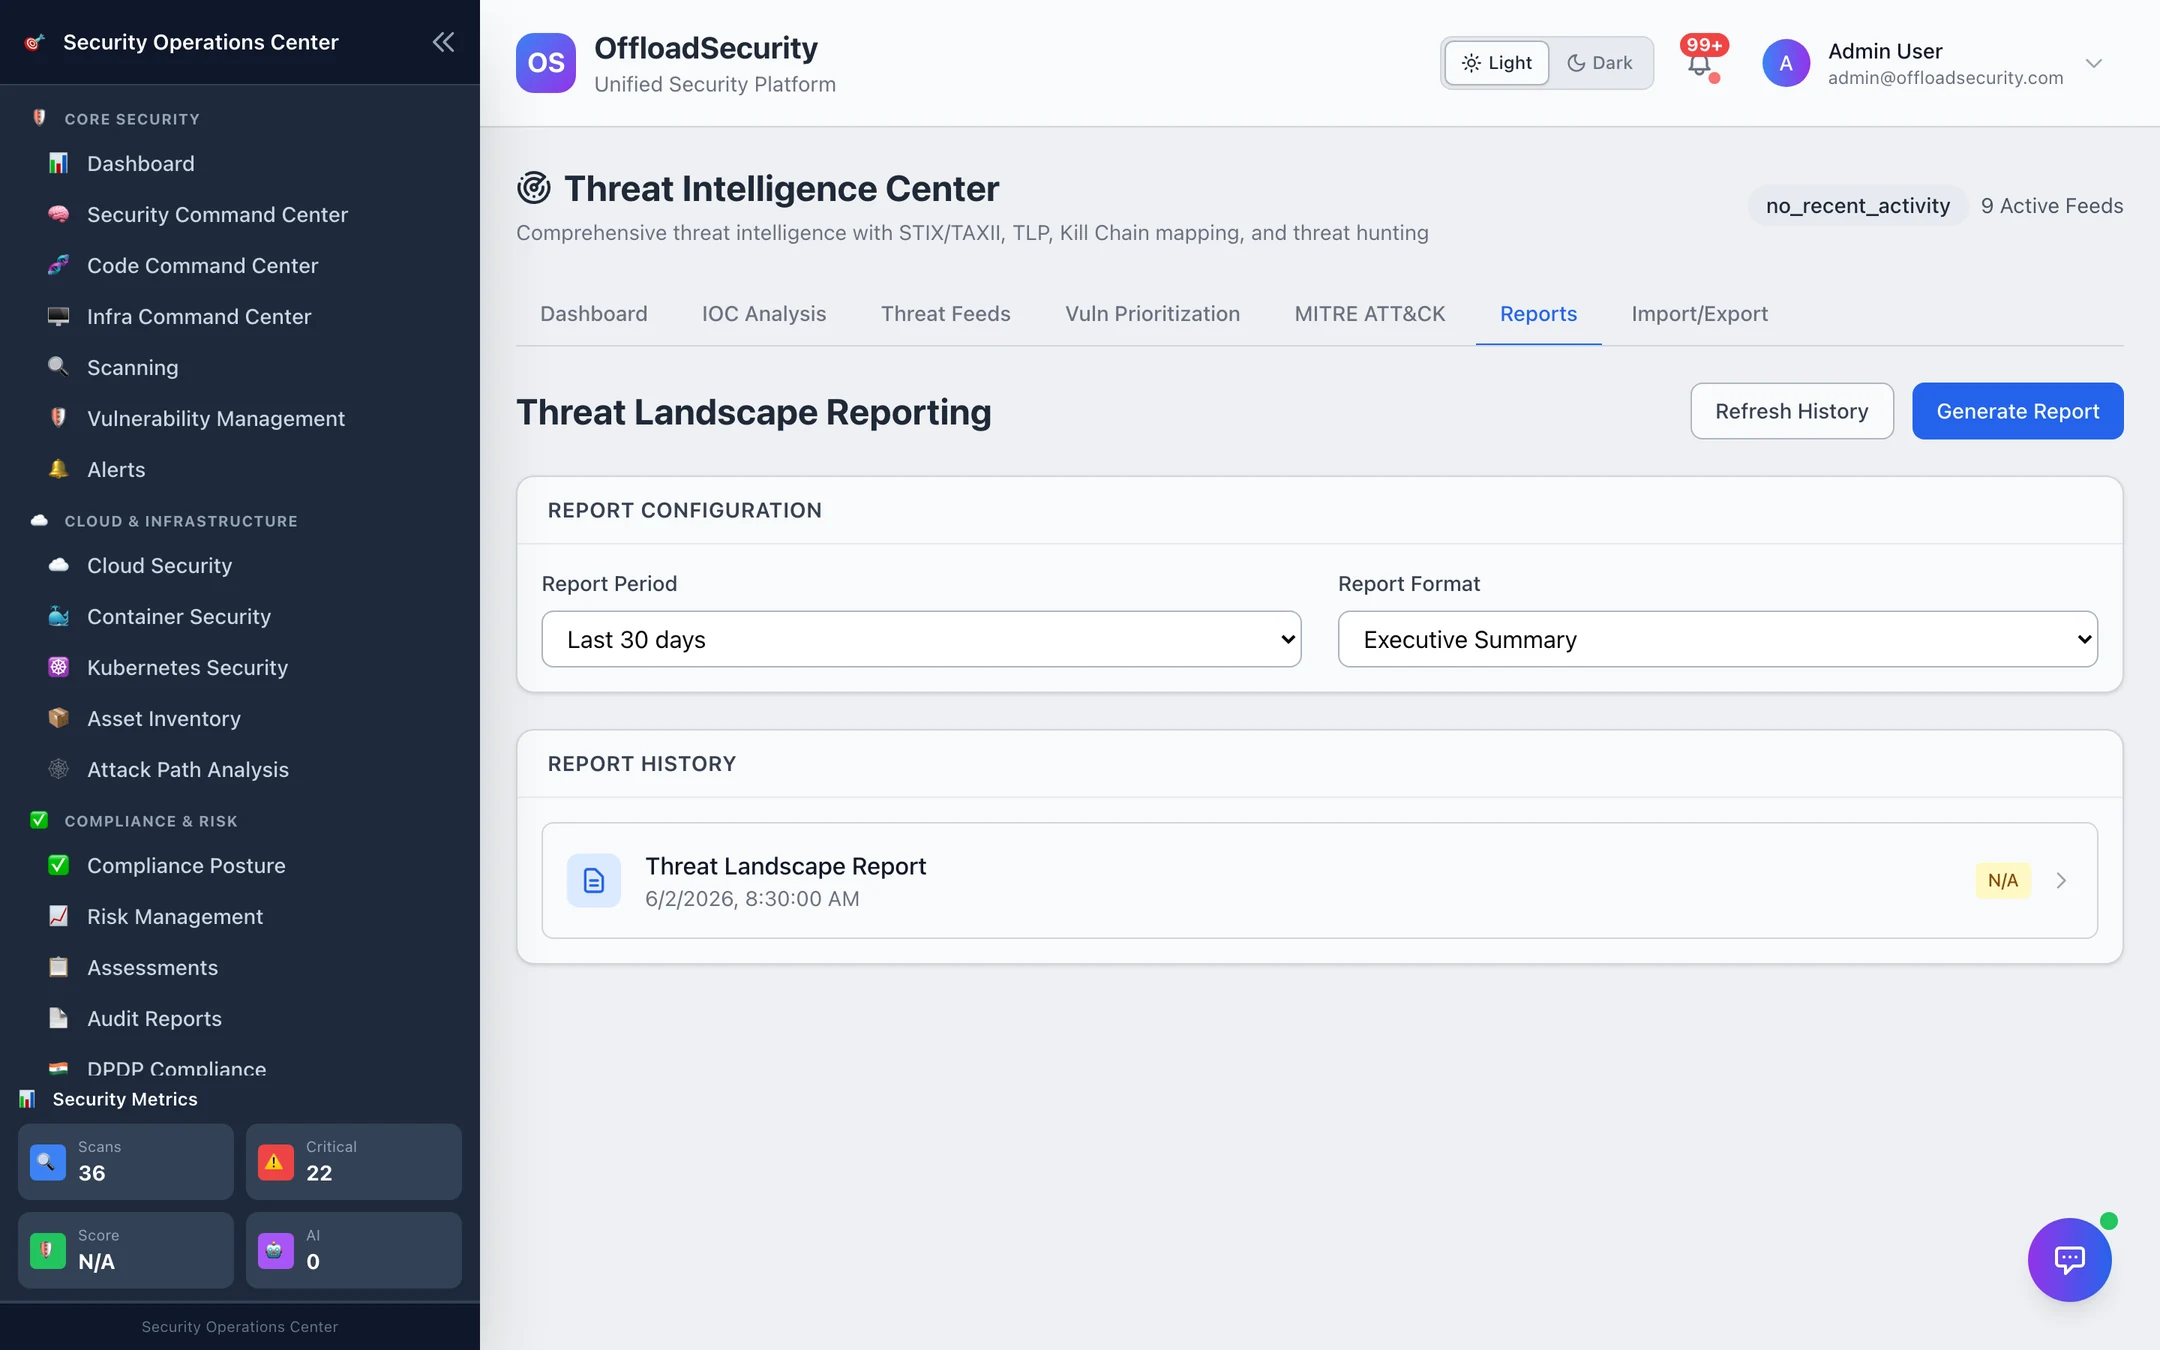
Threat Landscape Reporting generates a report for a period (last 7, 30 or 90 days) in a chosen format (Executive Summary, Technical Analysis, Comprehensive Report) from the team's indicators: threats analysed, new threats discovered, active actors and campaigns, top techniques, and recommendations. Reports are kept in Report History and retrievable over the API.
Import / export and indicator aging
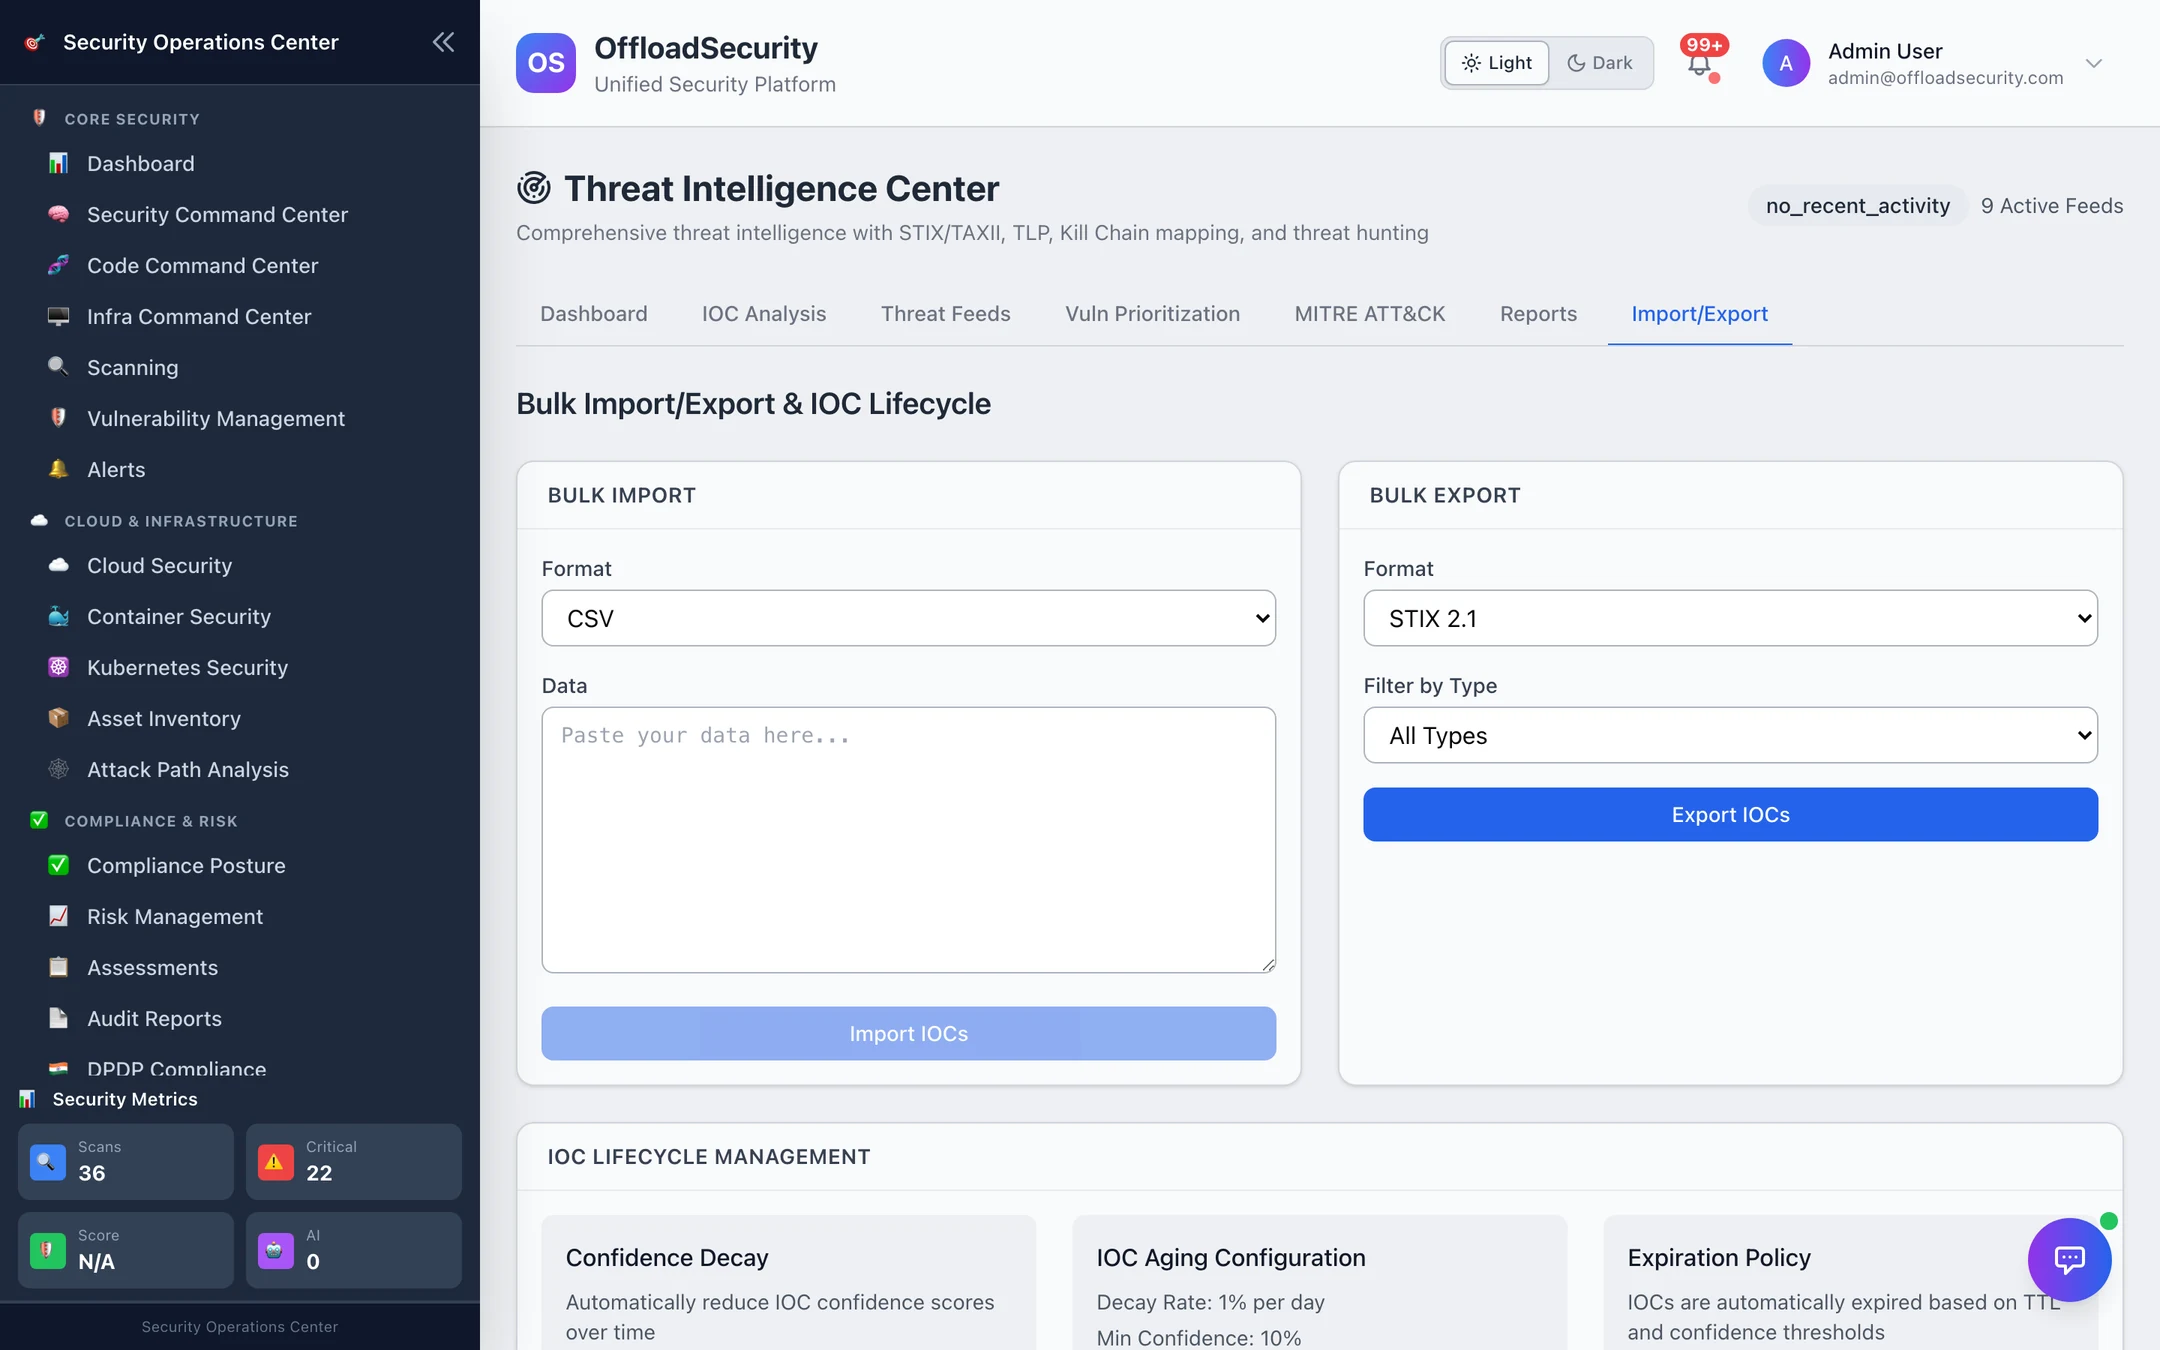
- Bulk import — paste CSV, JSON or STIX 2.1; indicators are validated, de-duplicated against what you hold and stored as team indicators.
- Bulk export — STIX 2.1 (or CSV / JSON), optionally filtered by indicator type, for sharing with a partner or loading into a SIEM.
- Indicator aging — confidence decays by a configurable percentage per day (default 0.5 %, floor 10 %), indicators expire after a default time-to-live of 90 days (configurable per type), and expired indicators are cleaned up daily. Aging is applied daily and can be applied on demand. This is why the dashboard's active threats is not a monotonically growing number.
Threat actors, campaigns, hunting queries and alert rules
The data model also holds threat actors (with TLP classification and ATT&CK techniques), campaigns attributed to them, saved hunting queries and alert rules that raise an alert when a matching indicator arrives. They are managed over the API today (/api/enhanced-threat-intelligence/…, see API); the tabs are not shown in the UI. Actors and campaigns you record feed the prioritisation score above.
Related
- Triage — where KEV and EPSS change the order of work.
- Security Command Center — the triage agent's KEV-driven Critical verdicts and threat hunts.
- Asset Inventory — what indicators are correlated against.