Attack Path Analysis
Individual findings rarely tell the whole story. A public instance is one finding; an over-privileged role attached to it is another; a customer database that role can read is a third. Attack Path Analysis connects them — it builds a graph of your environment and shows the routes an attacker could take, so you can fix the one link that breaks a whole path instead of working three tickets in isolation.
Where: left navigation → Attack Path Analysis (under Cloud & Infrastructure).
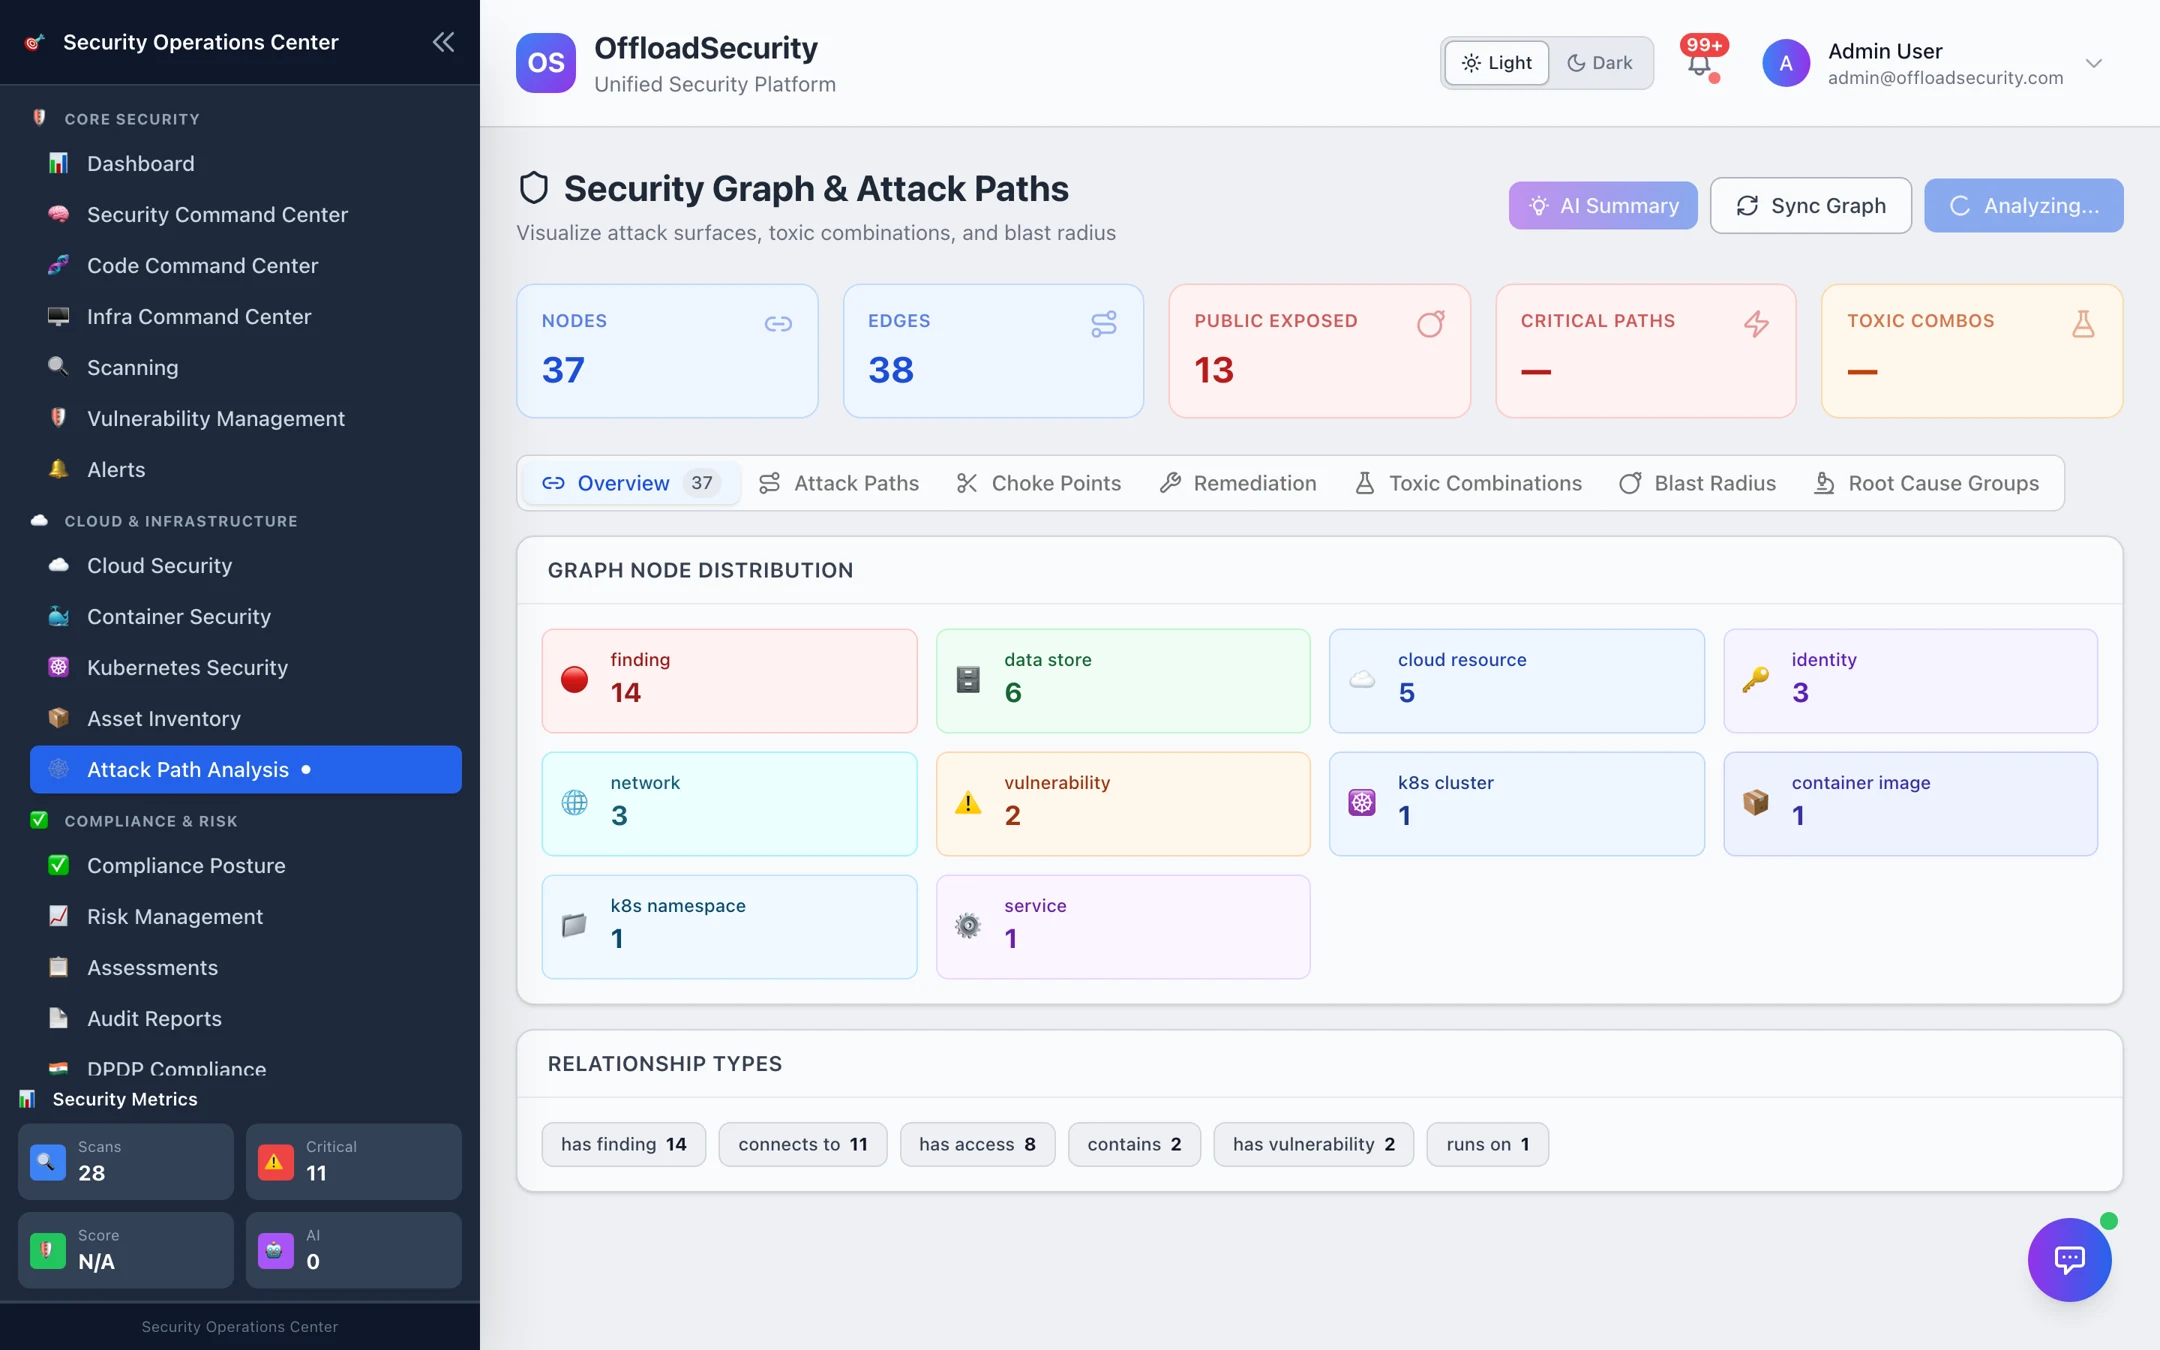
How it works
- Sync Graph ingests what the platform already knows — cloud assets and findings, identities from IAM analysis, container images and their vulnerabilities, Kubernetes namespaces and workloads — into a graph of nodes (cloud resource, data store, identity, network, vulnerability, finding, container image, k8s cluster / namespace, service) and edges (
has_finding,connects_to,has_access,can_escalate_to,contains,runs_on,has_vulnerability, …). - Run Attack Path Analysis evaluates 20 toxic-combination rules against the graph — for example public resource with an identity path to a data store, public data store with a high/critical finding, container with a critical CVE on a public-facing host, admin IAM identity with a high/critical finding, cross-account trust to an external entity, public Kubernetes cluster with a critical finding. Each match becomes an attack path with its steps annotated with MITRE ATT&CK tactics and techniques.
- Analytics rank what to fix: choke points (the edges most attack paths pass through), blast radius (everything reachable from a node), root-cause groups (findings that share one underlying cause) and a remediation view that simulates cutting a path.
The graph is only as complete as the data behind it. Connect cloud accounts, container registries and Kubernetes clusters, run an IAM analysis on key accounts, and the paths get sharper.
The tabs
| Tab | What you see |
|---|---|
| Overview | Node and edge counts, how many nodes are publicly exposed, critical paths and toxic combinations found, the node distribution by type, relationship types, the finding-severity breakdown and the highest attack surface (most-connected assets). |
| Attack Paths | Each detected path: entry point → hops → target, the rule that matched, risk score, MITRE tactics/techniques per step, and the affected assets. |
| Toxic Combos | The matched toxic-combination rules grouped by severity, with the resources involved. |
| Choke Points | Edges ranked by how many paths they carry — remove the top one and several paths disappear at once. |
| Blast Radius | Select any node to see everything reachable from it, grouped by resource type — the "if this box is popped, what else is exposed?" view. |
| Root Cause Groups | Findings clustered by shared cause (the same security group, role or policy), so one change closes many findings. |
| Remediation | The recommended fixes ordered by how many paths each one cuts, with a what-if simulation before you commit. |
Using it
- Sync Graph after your first scans complete (and again after onboarding new sources). Syncing runs in the background over thousands of records; the overview updates when it finishes.
- Run Attack Path Analysis. Start on the Overview tile counts, then open Attack Paths sorted by risk.
- For the top path, check Choke Points and Remediation — the fix that cuts the most paths is usually cheaper than fixing every finding along one path.
- Apply the fix in your cloud, re-scan the account, and re-run the analysis: resolved findings drop out of the graph and the path shortens or disappears.
- Promote a path you cannot fix quickly into the Risk Register so it is tracked and owned.
During an incident, select the compromised asset in Blast Radius to get the list of identities, data stores and networks reachable from it — a ready-made containment scope.
Related
- Asset Inventory — the resource catalog the graph is built from.
- Identity & Network Posture — IAM analysis populates the identity layer of the graph.
- Container Security and Kubernetes Security — the image and cluster layers.
- Vulnerability Management — triage the vulnerabilities that appear in paths.