Quickstart — first value in about 30 minutes
This guide gets you from "I have access" to "I'm reviewing my first findings" in a single sitting. It assumes the platform is already deployed and you have an account.
In roughly 30 minutes you will:
- Sign in and get oriented on the dashboard.
- Connect one cloud account (read-only — about 3 minutes of setup).
- Run your first scan and watch it complete.
- Open and understand a real finding.
- Push a finding to Jira and set up an alert channel.
When you finish, jump to the First 7 Days plan to turn this first scan into an operating security program.
A quick checklist so your first scan goes smoothly:
-
A platform account. Your administrator provides your login. What you can do depends on your role — viewing findings needs view access, while connecting accounts and starting scans needs management access. See RBAC & Team Management.
-
Permission to connect your first cloud account — the main setup step:
- AWS — the ability to create a read-only IAM role in the target account (the role Offload assumes is read-only; you need IAM access to create it). Ready-to-use Terraform is provided.
- GCP — a role that can create a service account and grant read-only access (Project IAM Admin or Owner); organization onboarding needs organization-level access.
- Azure — the ability to register an application and assign the Reader role on the subscription.
See Connecting Cloud Accounts for the exact permissions and copy-paste setup.
-
Nothing to install. There is no CLI or agent to download — everyday use is the web app, and CI/CD integration uses plain
curl/ the REST API or the GitHub Action. (Deploying the platform itself is a separate operator task — see On-Premises.) -
Time to value: connecting your first cloud account takes about 3 minutes; the first scan then runs in the background.
Every scan uses read-only credentials and only ever reads your environment; Offload never changes anything in your cloud. There's no separate sandbox to configure — but if you'd rather start small, scope your first scan to a single non-production account or region.
1. Sign in
- Open the platform URL in your browser — e.g.
https://yourdomain.com(the address your administrator gave you). - Enter your email and password on the login screen and select Sign in — or Sign in with … if your organisation uses single sign-on. If MFA is enabled on your account, enter the code from your authenticator app.
- On success you land on the Dashboard.
The first administrator account is created during platform setup. If you're the operator who installed the platform, sign in with the admin email and the password you set (DEFAULT_ADMIN_EMAIL / DEFAULT_ADMIN_PASSWORD). You can then invite teammates and assign roles from Team Management.
2. Tour the dashboard
The Dashboard is your security command center — a real-time summary of posture, recent activity, and quick actions into the most-used modules.
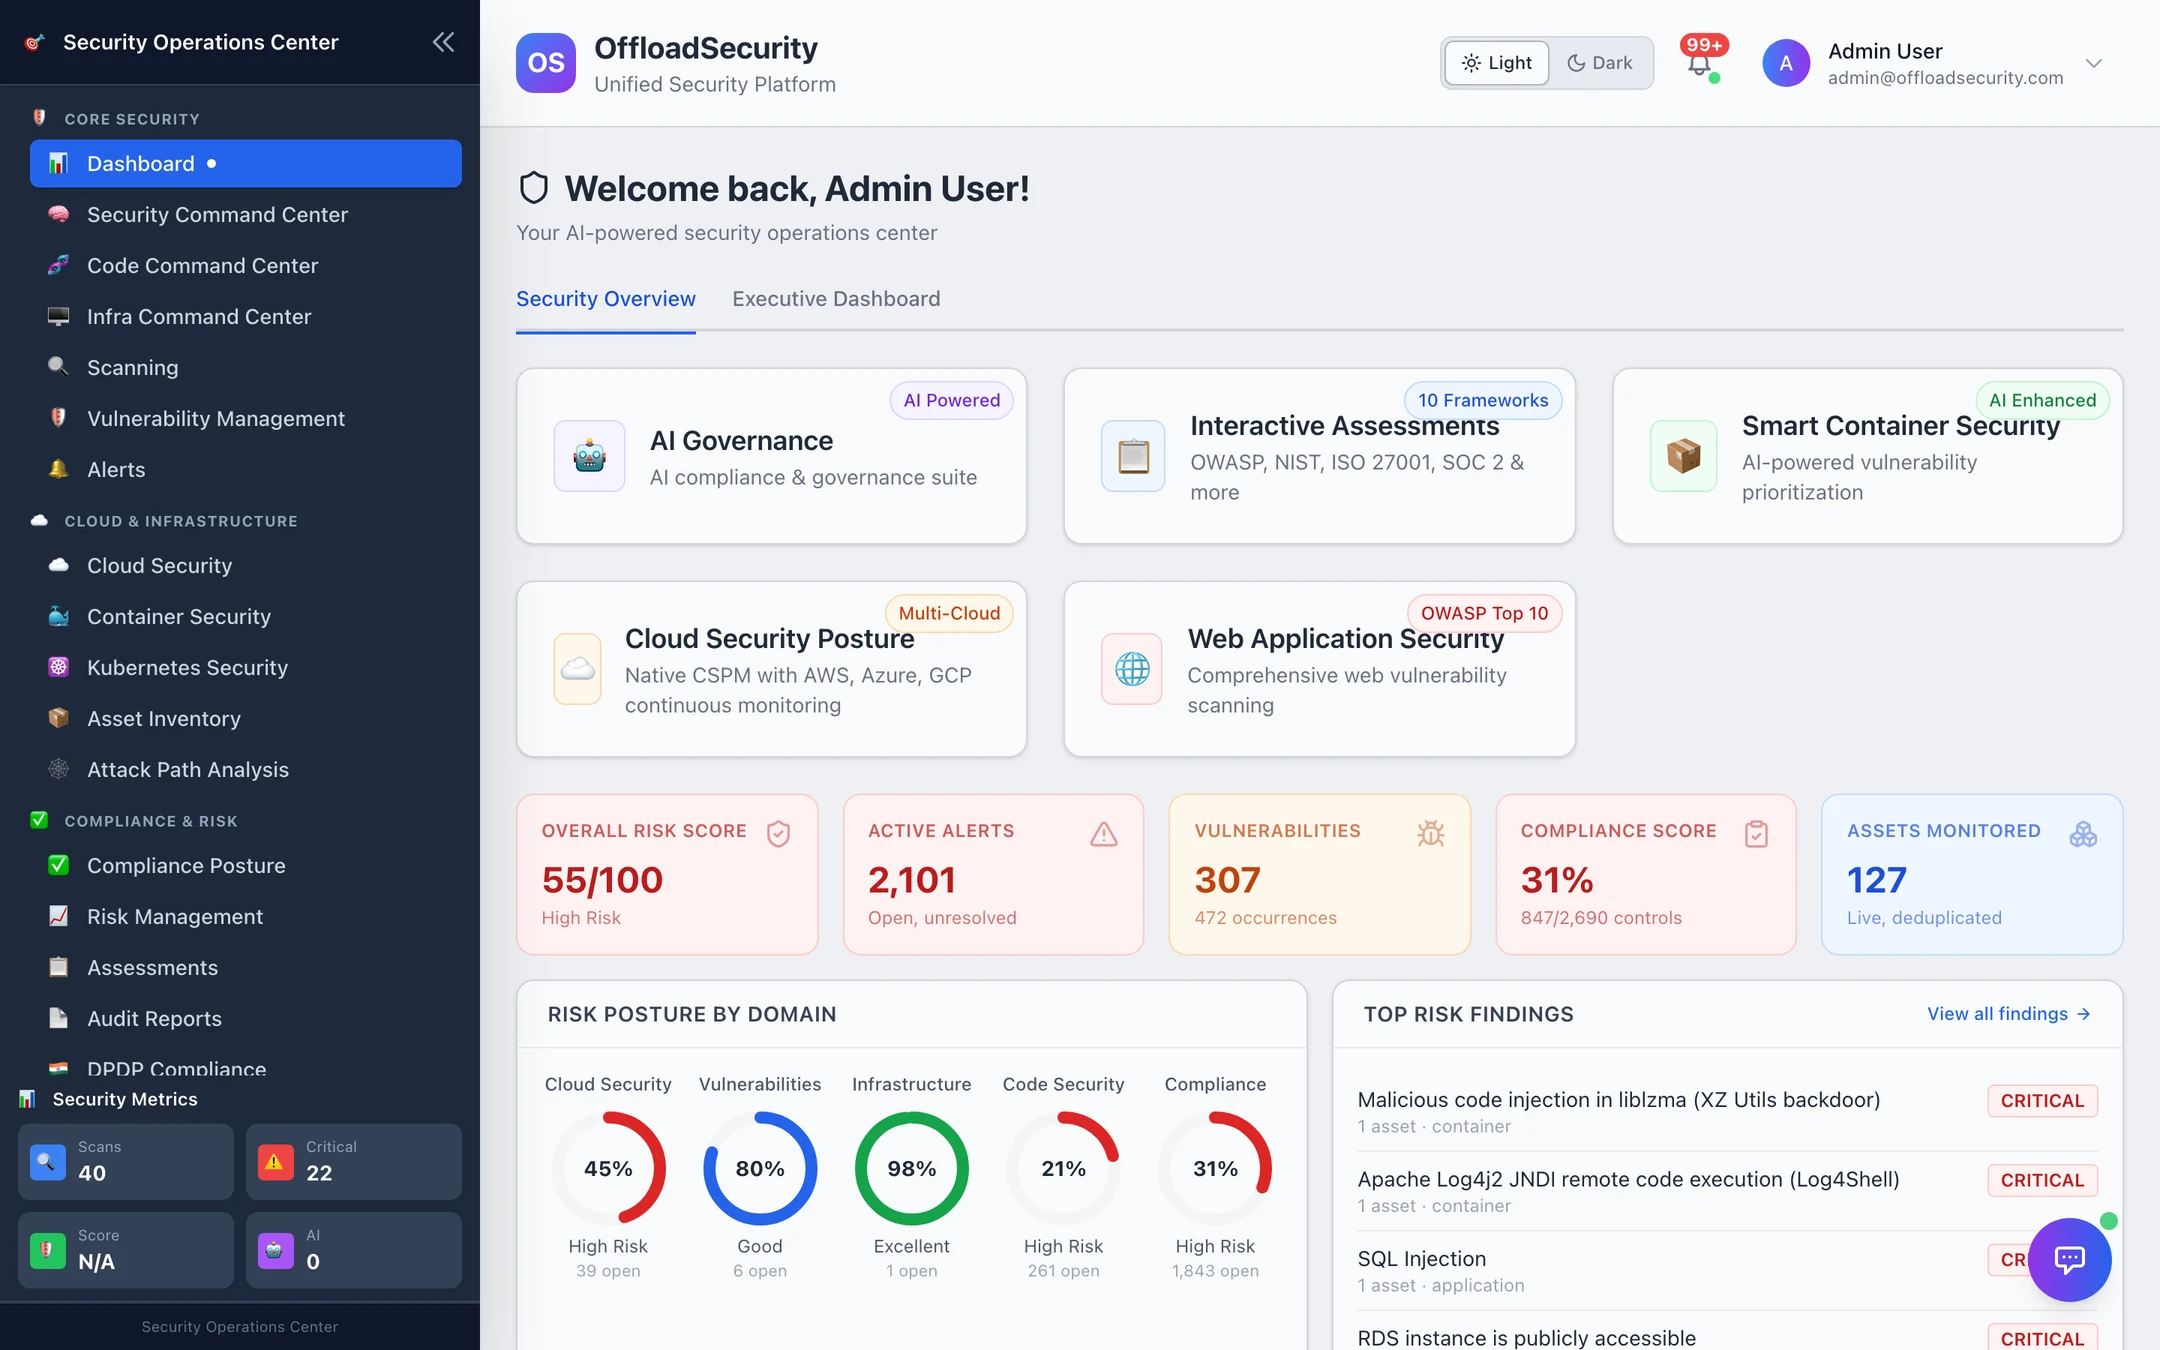
| Area | What it shows |
|---|---|
| Left navigation | Every module, grouped into Core Security, Cloud & Infrastructure, Compliance & Risk, Threat & Intelligence, and Management. |
| Quick-action cards | One-click entry into AI Governance, Assessments, Container Security, Cloud Security and Web Application Security. |
| Headline tiles | Overall risk score, active alerts, vulnerabilities (with occurrence count), compliance score, assets monitored. |
| Risk posture by domain · Top risk findings | Where the risk sits — cloud, vulnerabilities, infrastructure, code, compliance — and the findings to open first. |
| Executive Dashboard tab | The leadership view: framework readiness, gaps, roadmap and executive reports — see Executive Dashboard. |
3. Understand the core concepts
A few ideas appear throughout the platform. Knowing them up front makes everything else click.
Teams (multi-tenancy)
Every resource — scans, findings, assets, risks, reports — belongs to a team. You can be a member of multiple teams and switch between them; you only ever see data for your active team. This keeps environments (for example, separate clients or business units) cleanly isolated.
Roles (RBAC)
Access within a team is governed by role:
| Role | Typical use |
|---|---|
| Admin | Everything in the team — members, integrations, cloud accounts, all data. |
| Security Manager | Manage cloud accounts, scans, integrations, threat intelligence, remediations; invite members. |
| Security Analyst | Run scans, work findings and triage, create risks, work assessments. |
| Compliance Officer | Assessments, executive dashboard, reports, AI helpers. |
| Auditor | Read-only across security data, with report export. |
| Viewer | Read-only dashboards, scans, risks, reports, alerts. |
The full permission matrix is in Roles, Teams & API Keys.
The data flow: Scan → Finding → Risk → Report
This is the backbone of how work moves through the platform:
- Scan — you (or a schedule, or your CI pipeline) run a scan against a target: a cloud account, a container image, a web app, a Kubernetes cluster, or source code.
- Finding — results are normalized into findings/vulnerabilities with severity, affected resource, and remediation guidance, then deduplicated.
- Risk — significant findings (and compliance gaps) can be promoted into the Risk Register with treatment plans and SLAs.
- Compliance & Reports — findings map to framework controls, and everything can be exported as an audit-ready report.
4. Your first scan — a guided walkthrough
Follow this end-to-end path to go from a connected environment to a tracked, alerted finding. Each step notes what success looks like and how to confirm it in the product.
Step 1 — Connect a cloud account
In Cloud Security → Cloud Accounts, select Add Cloud Account and follow Connecting Cloud Accounts for your provider (read-only, with copy-paste Terraform).
- Expected result: the account appears with a Connected / Active status, and an initial posture scan can start automatically — trigger one from Cloud Security if it doesn't.
- Verify: the account is listed as Connected, and you can see a scan in progress with a scan run ID.
Step 2 — Run and watch a scan
Start a cloud scan at any time (an initial scan may already have started on connect), or run a native web / API / network scan against a target you own.
- Expected result: the scan reaches Completed (or Partial, if some checks couldn't run), and findings appear.
- Verify: on the Scans page the status shows Completed with a finding count — open it to see the results.
Step 3 — Understand a finding
Open Vulnerability Management and select a finding.
- Expected result: the finding shows its severity, the affected resource, remediation guidance, and exploit context (CISA KEV / EPSS where applicable).
- Verify: you can see the affected asset and a concrete remediation step — and the same issue found by two scanners appears as one deduplicated record.
Step 4 — Create a remediation ticket
With Jira connected, critical findings get a ticket automatically; for a high finding, select it under Vulnerability Management → Raw Findings and choose Create Jira Ticket.
- Expected result: a Jira issue is created and linked to the finding.
- Verify: the finding shows its ticket key, and the Jira tab in Vulnerability Management lists it; when the ticket is closed in Jira the finding resolves within 15 minutes.
Step 5 — Configure an alert
Connect Slack or Microsoft Teams under Integrations — the connection test posts a message to the channel — or set up a webhook subscription for your SIEM. See Notifications.
- Expected result: new or reopened alerts of high severity and above reach the channel; every alert appears in the bell and in Alerts regardless.
- Verify: the wizard's test message arrived; the next high or critical finding produces a channel post.
Then automate it
Once the manual path works, gate your CI/CD pipelines on scan results so this runs on every build.
You can change your active team at any time from the account menu in the top-right. Make sure you're in the right team before running scans or reviewing data.
You're done when…
Use this checklist to confirm the quickstart worked end to end:
- At least one cloud account shows Connected / Active in Cloud Security.
- One scan has reached Completed and produced findings.
- You've opened a finding and can name its affected resource and remediation step.
- A finding is linked to a Jira ticket (or you've consciously skipped ticketing for now).
- A notification channel (Slack, Teams, email, or webhook) received a test message.
If any box won't check, see Troubleshooting.
Where to next
- First 7 Days — a day-by-day plan that takes this first scan to an operating program: baseline, prioritization, SLAs, compliance, shift-left, and executive reporting.
- Recommended Production Configuration — opinionated starting points for schedules, alerting, and coverage.
- Role guides: the Security Engineer journey or the Compliance Officer journey, depending on what you're here to do.