Integrations & Notifications
Integrations connect Offload Security to the tools your team already uses — so findings, alerts, and evidence flow into your existing workflows instead of staying locked in one more dashboard. From here you can send security alerts to Slack, Microsoft Teams, or email, open tickets in Jira or ServiceNow, forward events to your SIEM, gate your CI/CD pipeline on scan results, and monitor the health of every connection in one place.
What it does
Integrations fall into a few groups:
- Notifications — push real-time alerts to Slack, Microsoft Teams, email (SMTP), and in-app toasts. Alerts cover security findings, scan failures, and platform events.
- Ticketing — create and sync issues in Jira and ServiceNow so findings become tracked work items.
- SIEM & SOAR — forward events and findings to tools like Splunk and Wazuh for correlation and long-term retention.
- Security tooling — connect external scanners and analysis tools (for example OWASP ZAP and SonarQube) into the platform.
- CI/CD — run scans from your pipeline and fail builds on policy violations using the CLI and the official GitHub Action.
Every integration belongs to a team. Credentials you enter are encrypted at rest and isolated by team, so connecting a tool in one team never exposes it to another. Make sure your active team is correct before adding a connection.
How to use it
1. Connect a tool
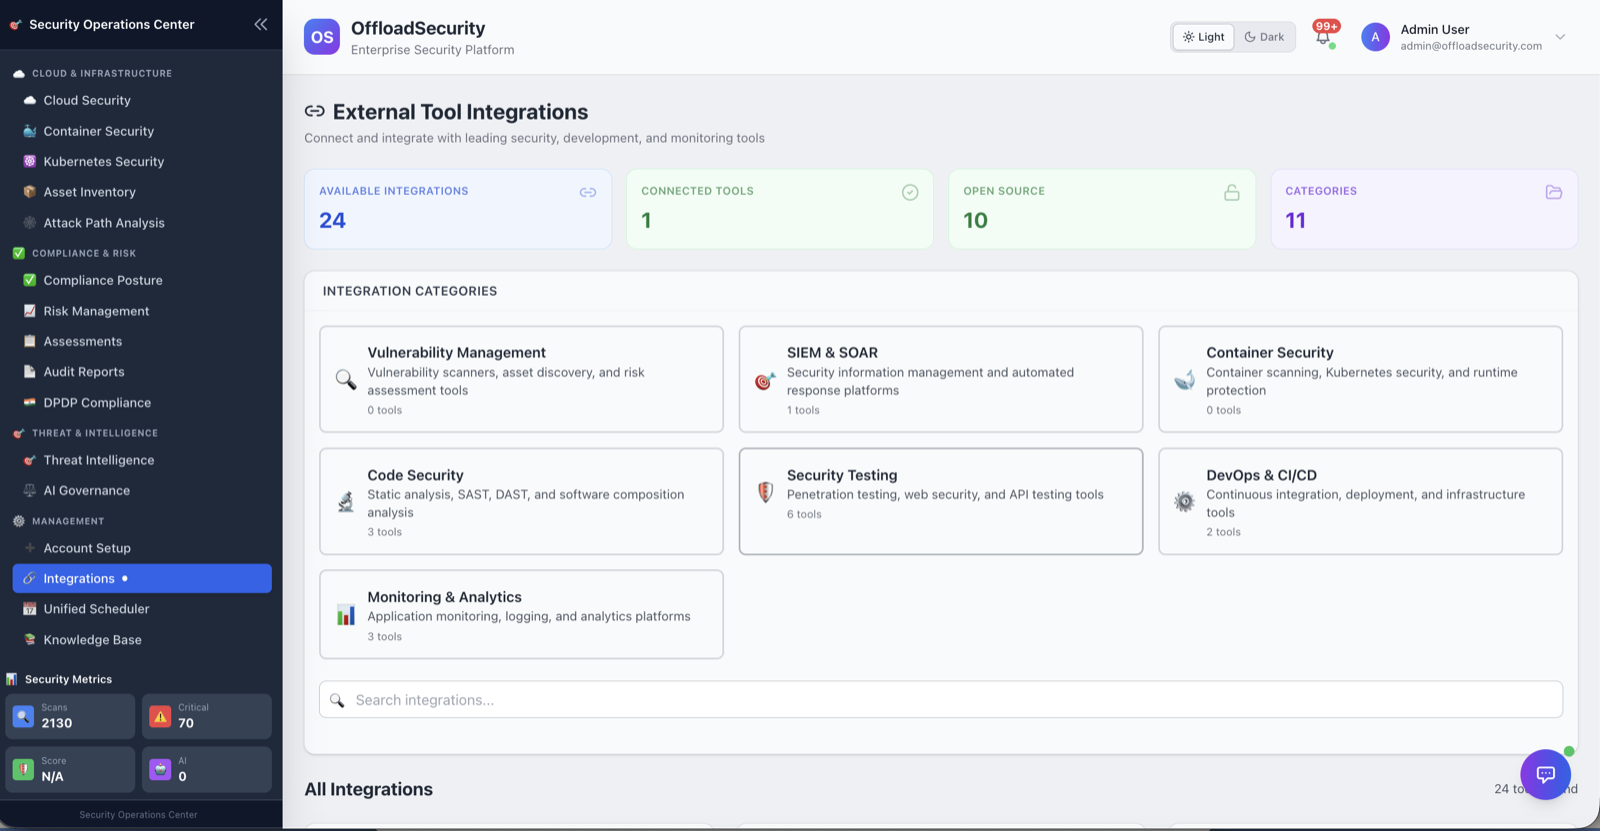
- Go to Integrations in the left navigation.
- Browse the catalog and select the tool you want to connect.
- Enter the required credentials or configuration for that tool (for example an API token, webhook URL, or service account).
- Save. The platform validates the connection and the integration's status updates to Connected.
2. Set up notifications
Notification channels are configured under Integrations → Notifications.
- Email — provide SMTP settings to send alerts to your team's inboxes.
- Microsoft Teams — add an incoming webhook URL for the channel you want alerts in.
- Slack — add one or more Slack webhook URLs and route alerts intelligently (see below).
When a scan fails, the platform classifies the failure (for example a connectivity issue, bad credentials, a tool error, a timeout, or a permission problem) and includes a plain-language remediation hint in the alert, so the on-call engineer knows what to check first.
3. Route Slack alerts to the right channels
Slack support goes beyond a single firehose channel. You can create routing rules that send each alert to a specific Slack channel based on:
- Category — system error, system notification, or security alert.
- Source module — for example Cloud Security, Kubernetes, container/registry scanning, code scanning, threat intelligence, or SLA breaches.
- Severity — critical, high, medium, low, or info.
A typical setup might route critical security alerts to #security-critical, lower-severity findings to #security-findings, and operational errors to #ops-alerts. If no rule matches an alert, it falls back to your default Slack channel.
After adding a Slack channel, use Send test message to confirm the webhook works and the alert lands in the right place before you rely on it. A status view shows which channels are configured.
4. Wire scans into CI/CD
Run security scans as part of your build and gate merges on the results:
- Use the CLI to trigger scans and pull findings from your pipeline.
- Use the official GitHub Action to scan on pull requests and fail the build when new high-severity findings or policy violations appear.
See CLI & CI/CD integration for setup steps and examples.
Monitor integration health
The platform continuously watches your connections so you find out about a broken integration before it silently drops alerts or stops syncing tickets.
- A background health monitor runs scheduled checks against each active integration and records the result.
- Each integration shows a connection status and the time of its last sync so you can spot a stale or failing connection at a glance.
- If a sync fails, the integration is flagged and an error message explains what went wrong.
A connection that shows Connected but hasn't synced recently usually points to expired credentials or a rotated token. Re-open the integration and re-enter its credentials to restore syncing.
API tokens, webhook URLs, and service-account keys can be revoked or expire on the provider side. When that happens the integration's status turns to an error state. Rotate credentials proactively and update them here to avoid missed alerts.
Related
- Notifications & Event Bus — channels, routing, and alert delivery in detail.
- Third-Party Integrations — the full catalog of connectable tools.
- CLI & CI/CD integration — automate scans in your pipeline.
- Team Management — set your active team and manage roles and API keys.