Executive Dashboard
Leadership does not ask which SCF control is partial; it asks are we ready for the SOC 2 audit, what is in the way, and when will it be fixed. The Executive Dashboard answers those three questions from the same control-state scorer as Compliance Posture, so the number on the slide is the number on the analyst's screen.
Where: left navigation → Dashboard → Executive Dashboard tab.
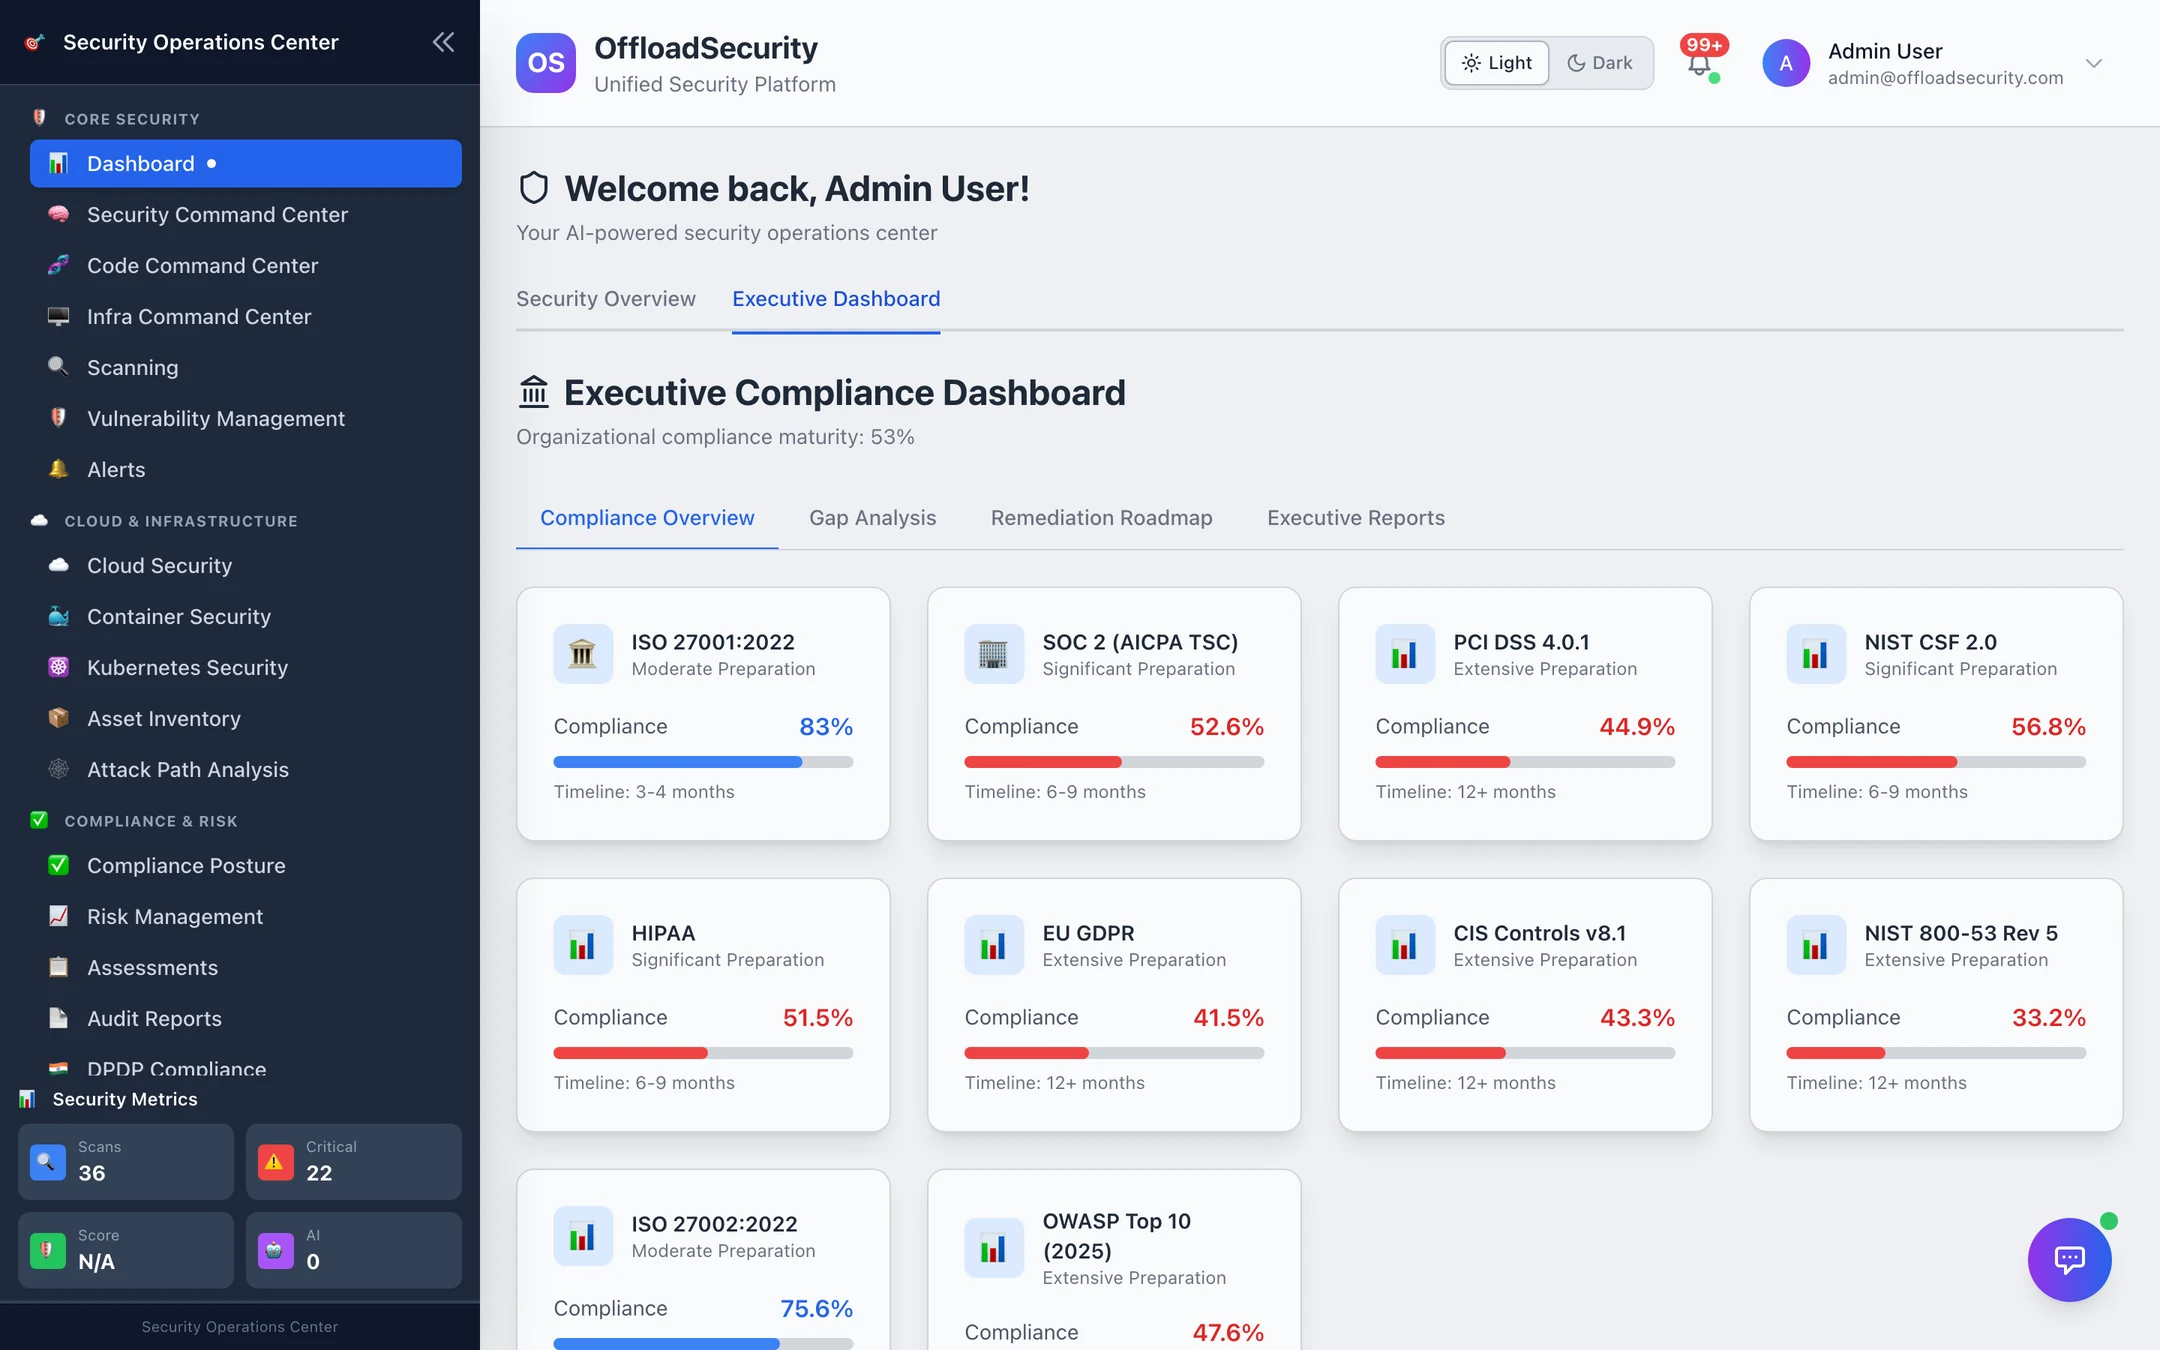
Compliance overview
-
Organisational compliance maturity — the average score of your active frameworks.
-
One card per active framework with its score and a readiness band:
Score Readiness Indicative timeline ≥ 95 Certification ready Ready now 85–94 Minor gaps 1–2 months 70–84 Moderate preparation 3–4 months 50–69 Significant preparation 6–9 months < 50 Extensive preparation 12+ months -
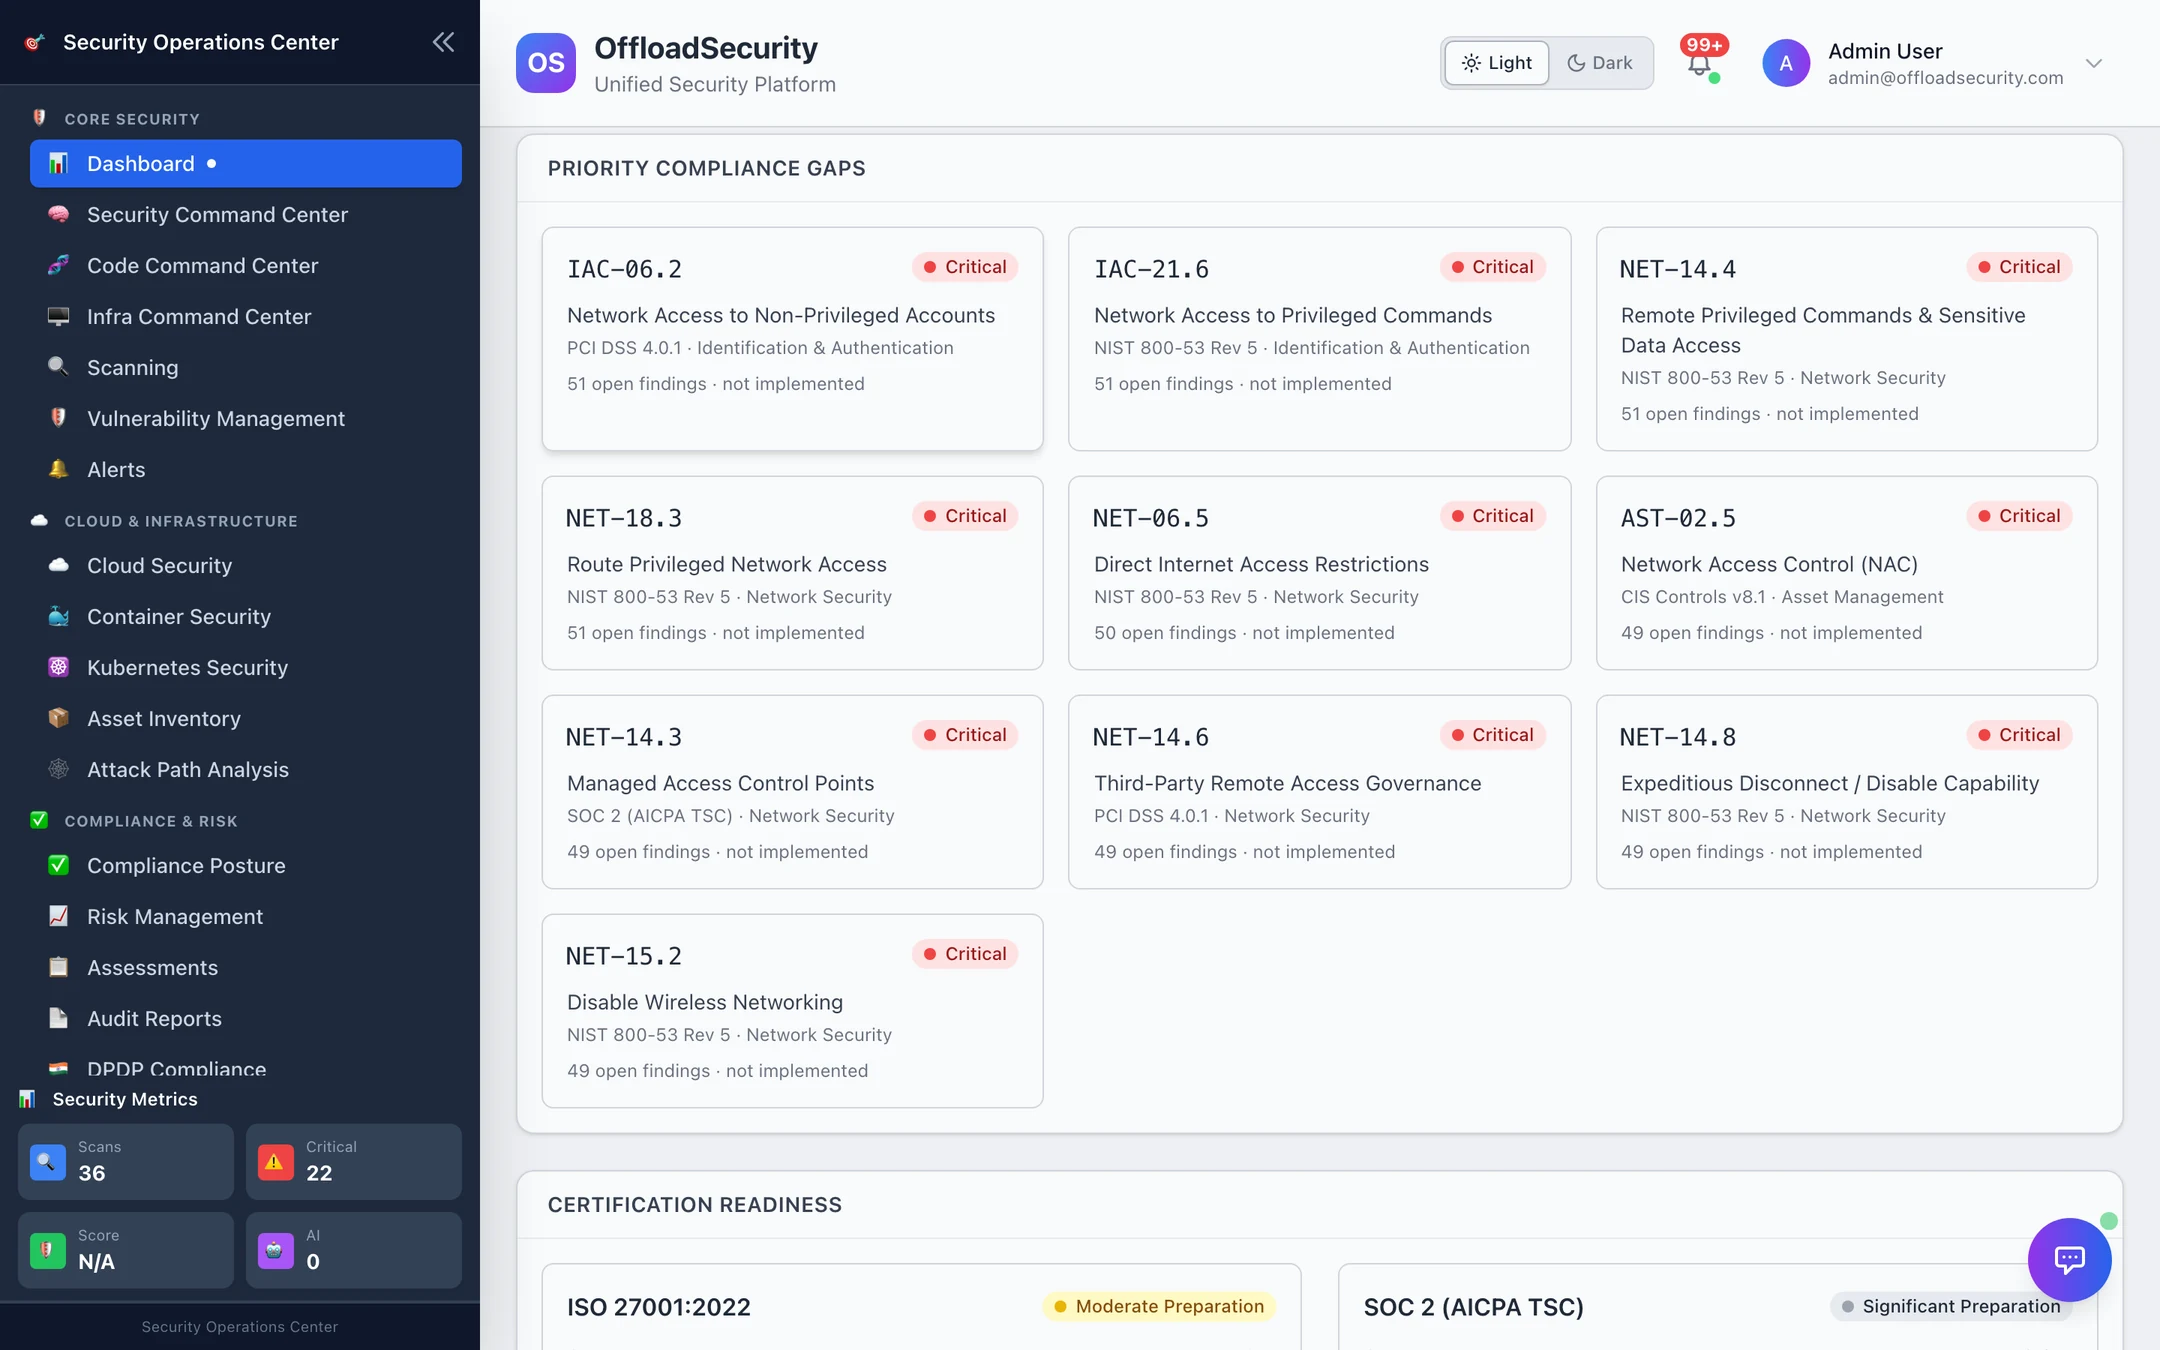
Priority compliance gaps — SCF controls holding frameworks back, with control name, framework, domain, status and the number of open findings behind each. Priority is derived from state, not typed in: not implemented with open findings → Critical; not implemented, or partial with open findings → High; other partial → Medium.
-
Certification readiness for the certifiable frameworks you have active (ISO 27001, SOC 2, PCI DSS, HIPAA, ISO 27701, ISO 42001) with score, timeline and next steps; compliance strengths (frameworks at 85% or above); the 90-day trend from the daily posture snapshots; recommended actions.
Gap analysis
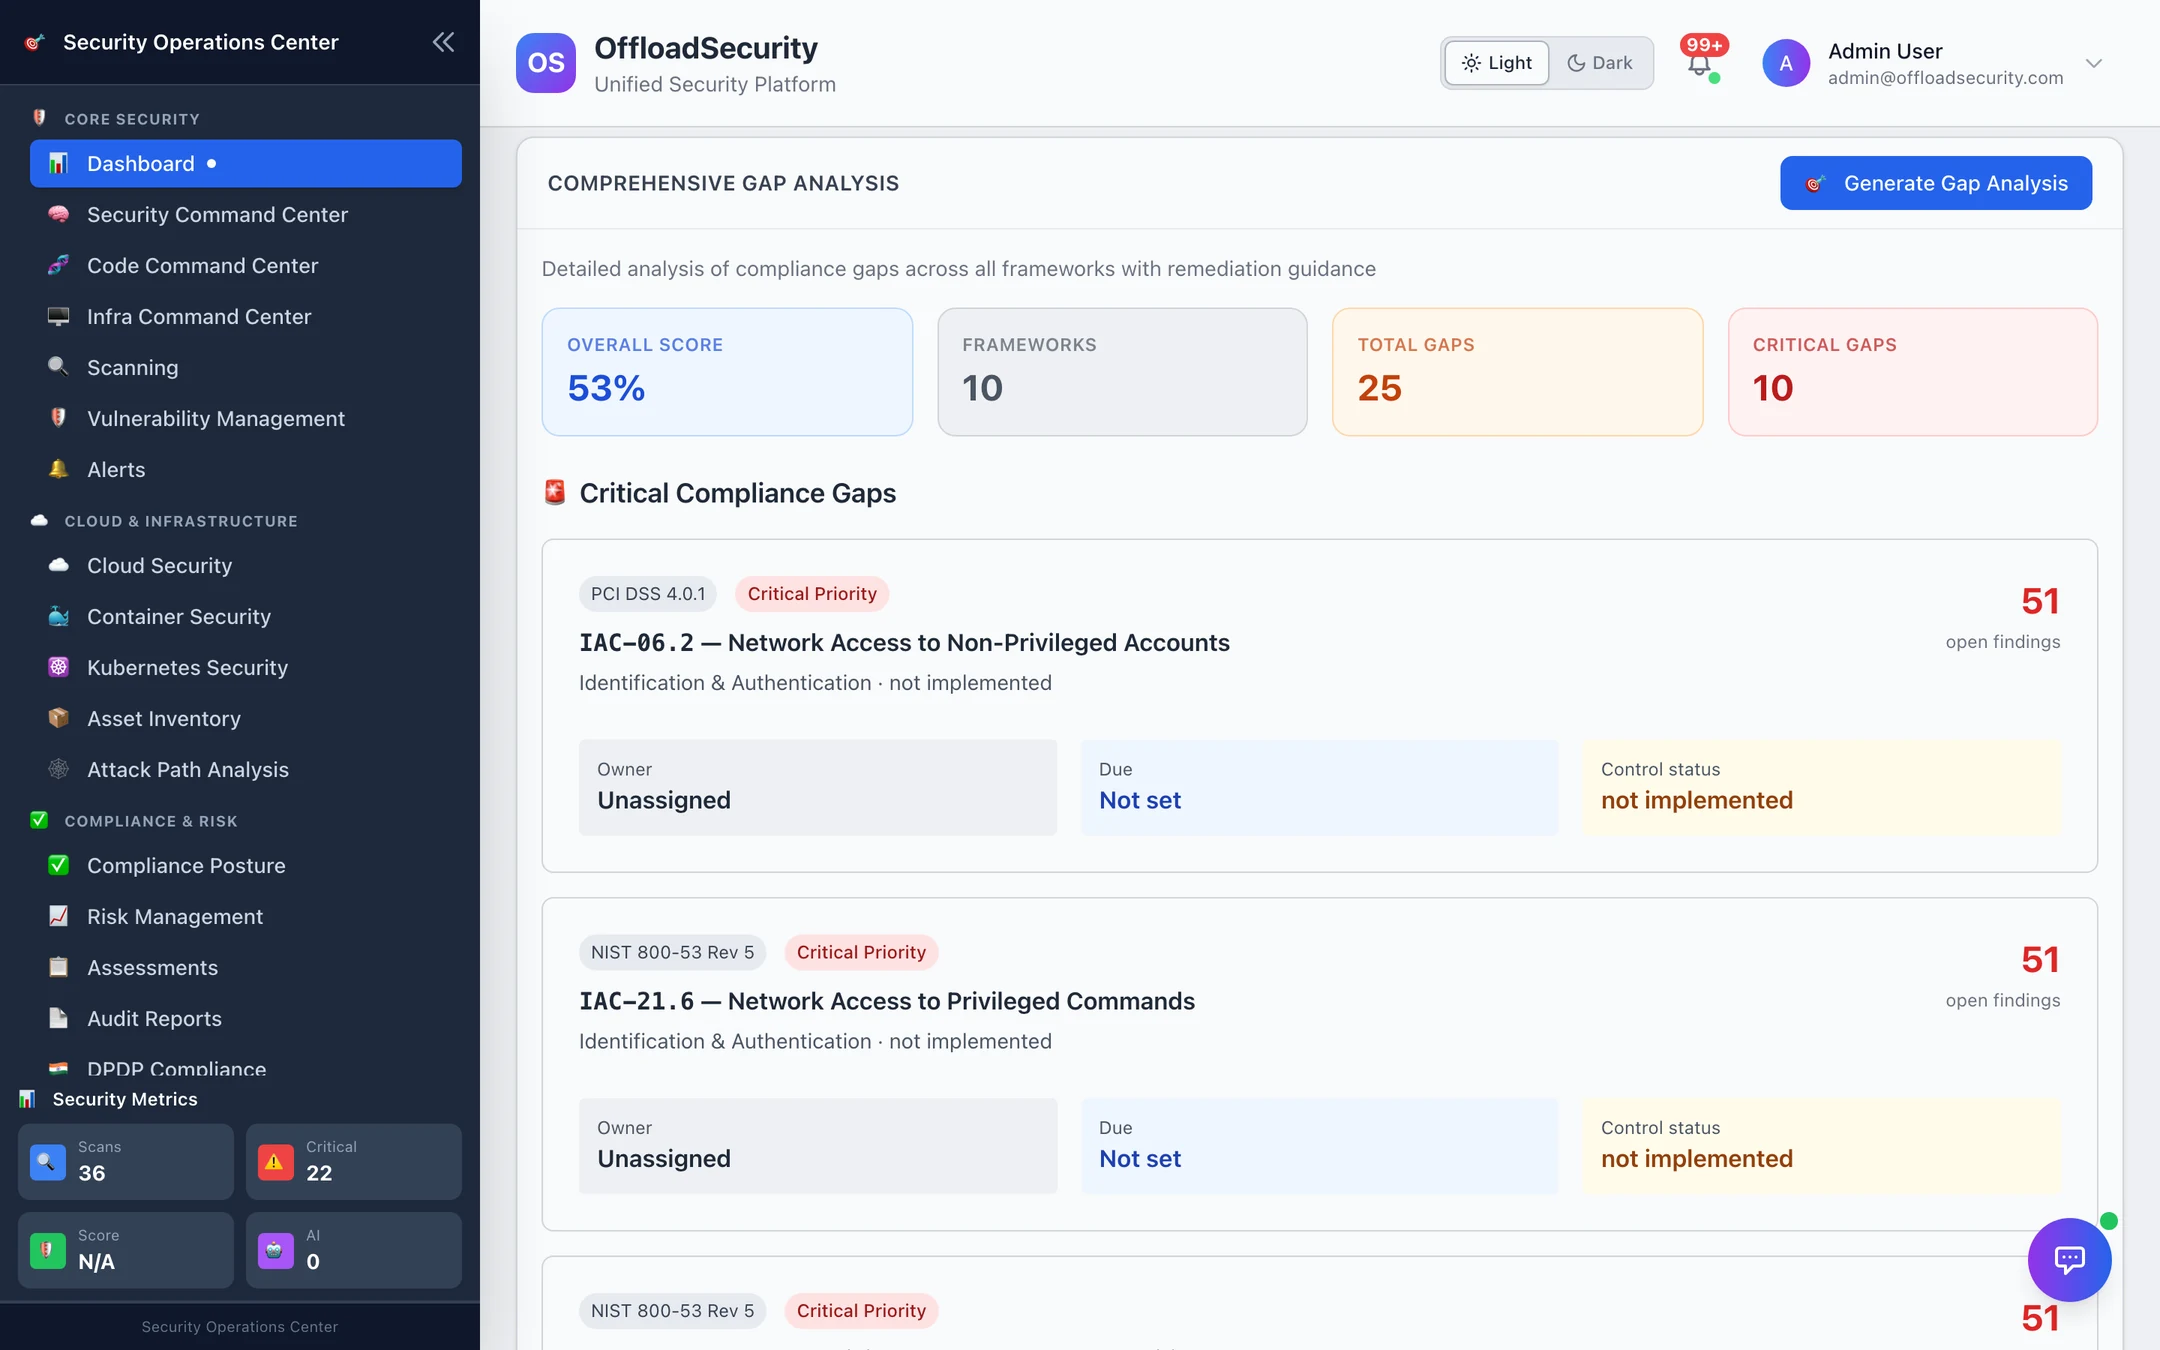
Generate Gap Analysis turns the current gaps into a document: overall score, frameworks analysed, gaps by priority, the critical gaps in full, per-framework gap counts, recommendations grouped as immediate (0–30 days), short-term (1–3 months) and long-term (3–6 months), and a risk-impact assessment (financial, operational, reputational). Export it as PDF or email it to stakeholders from the buttons at the bottom.
Remediation roadmap
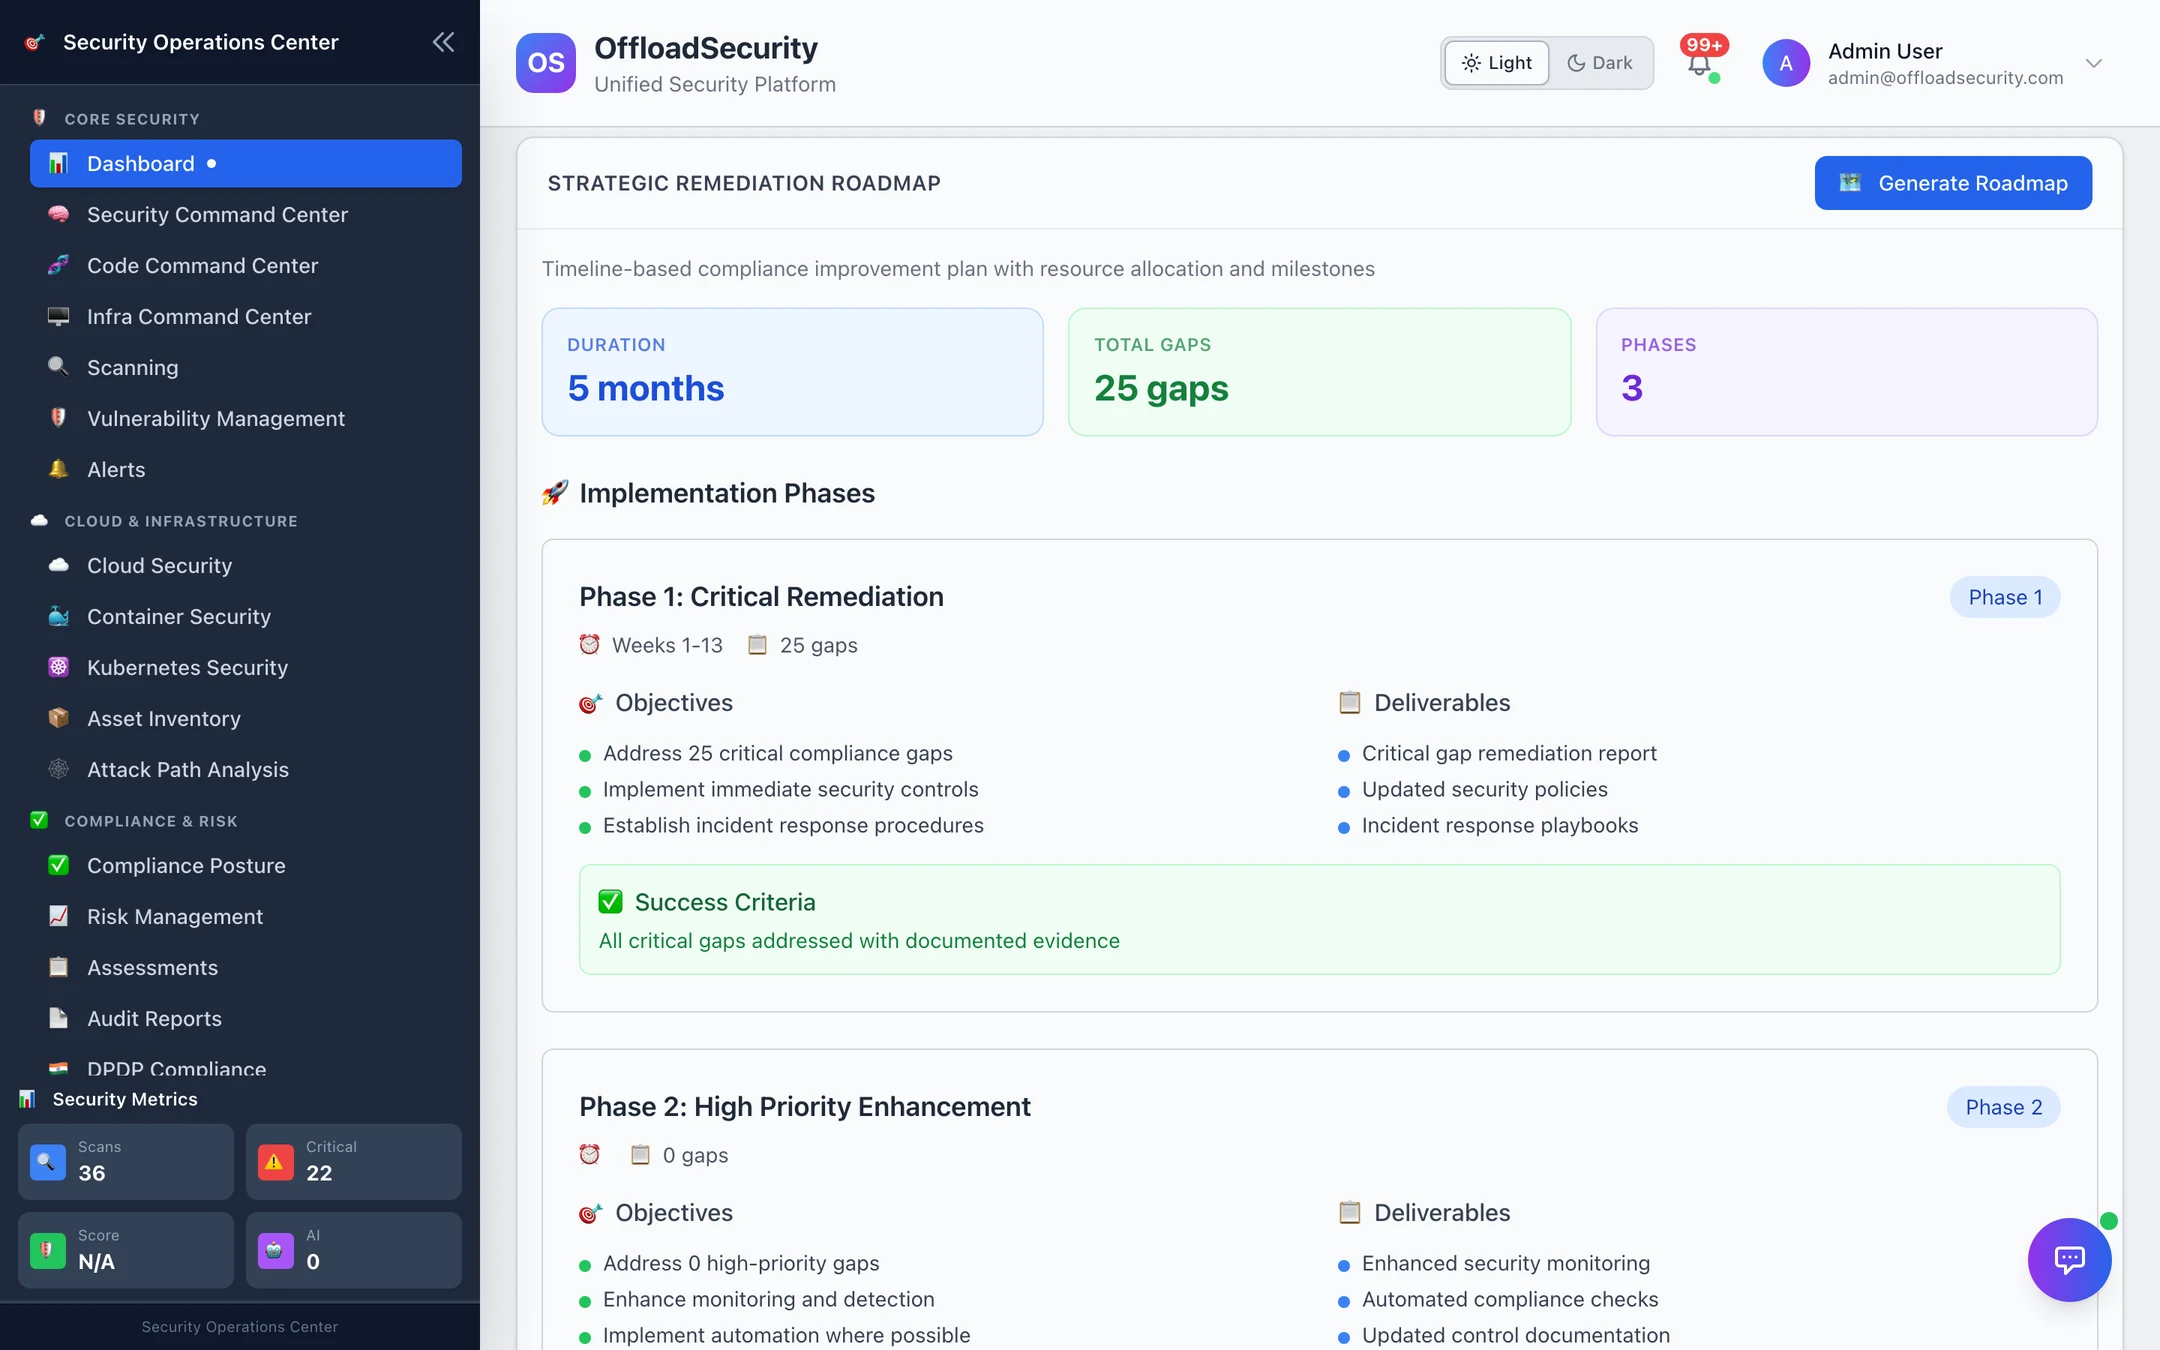
Generate Roadmap lays the gaps out in three phases — critical remediation, high-priority enhancement, optimisation & certification — each with objectives, deliverables and success criteria. Phase lengths are sized for controls worked in parallel (roughly a week per two critical gaps, a week per three high gaps, and a fixed four-week certification phase), run consecutively, and a phase with no gaps has no timeline. Milestone progress can be updated over the API as work lands, and gaps can be assigned an owner and a status.
It is a planning skeleton generated from your gap list, not an effort estimate for your organisation. Use it to structure the conversation; replace the durations with your own once owners have looked at the gaps.
Executive reports
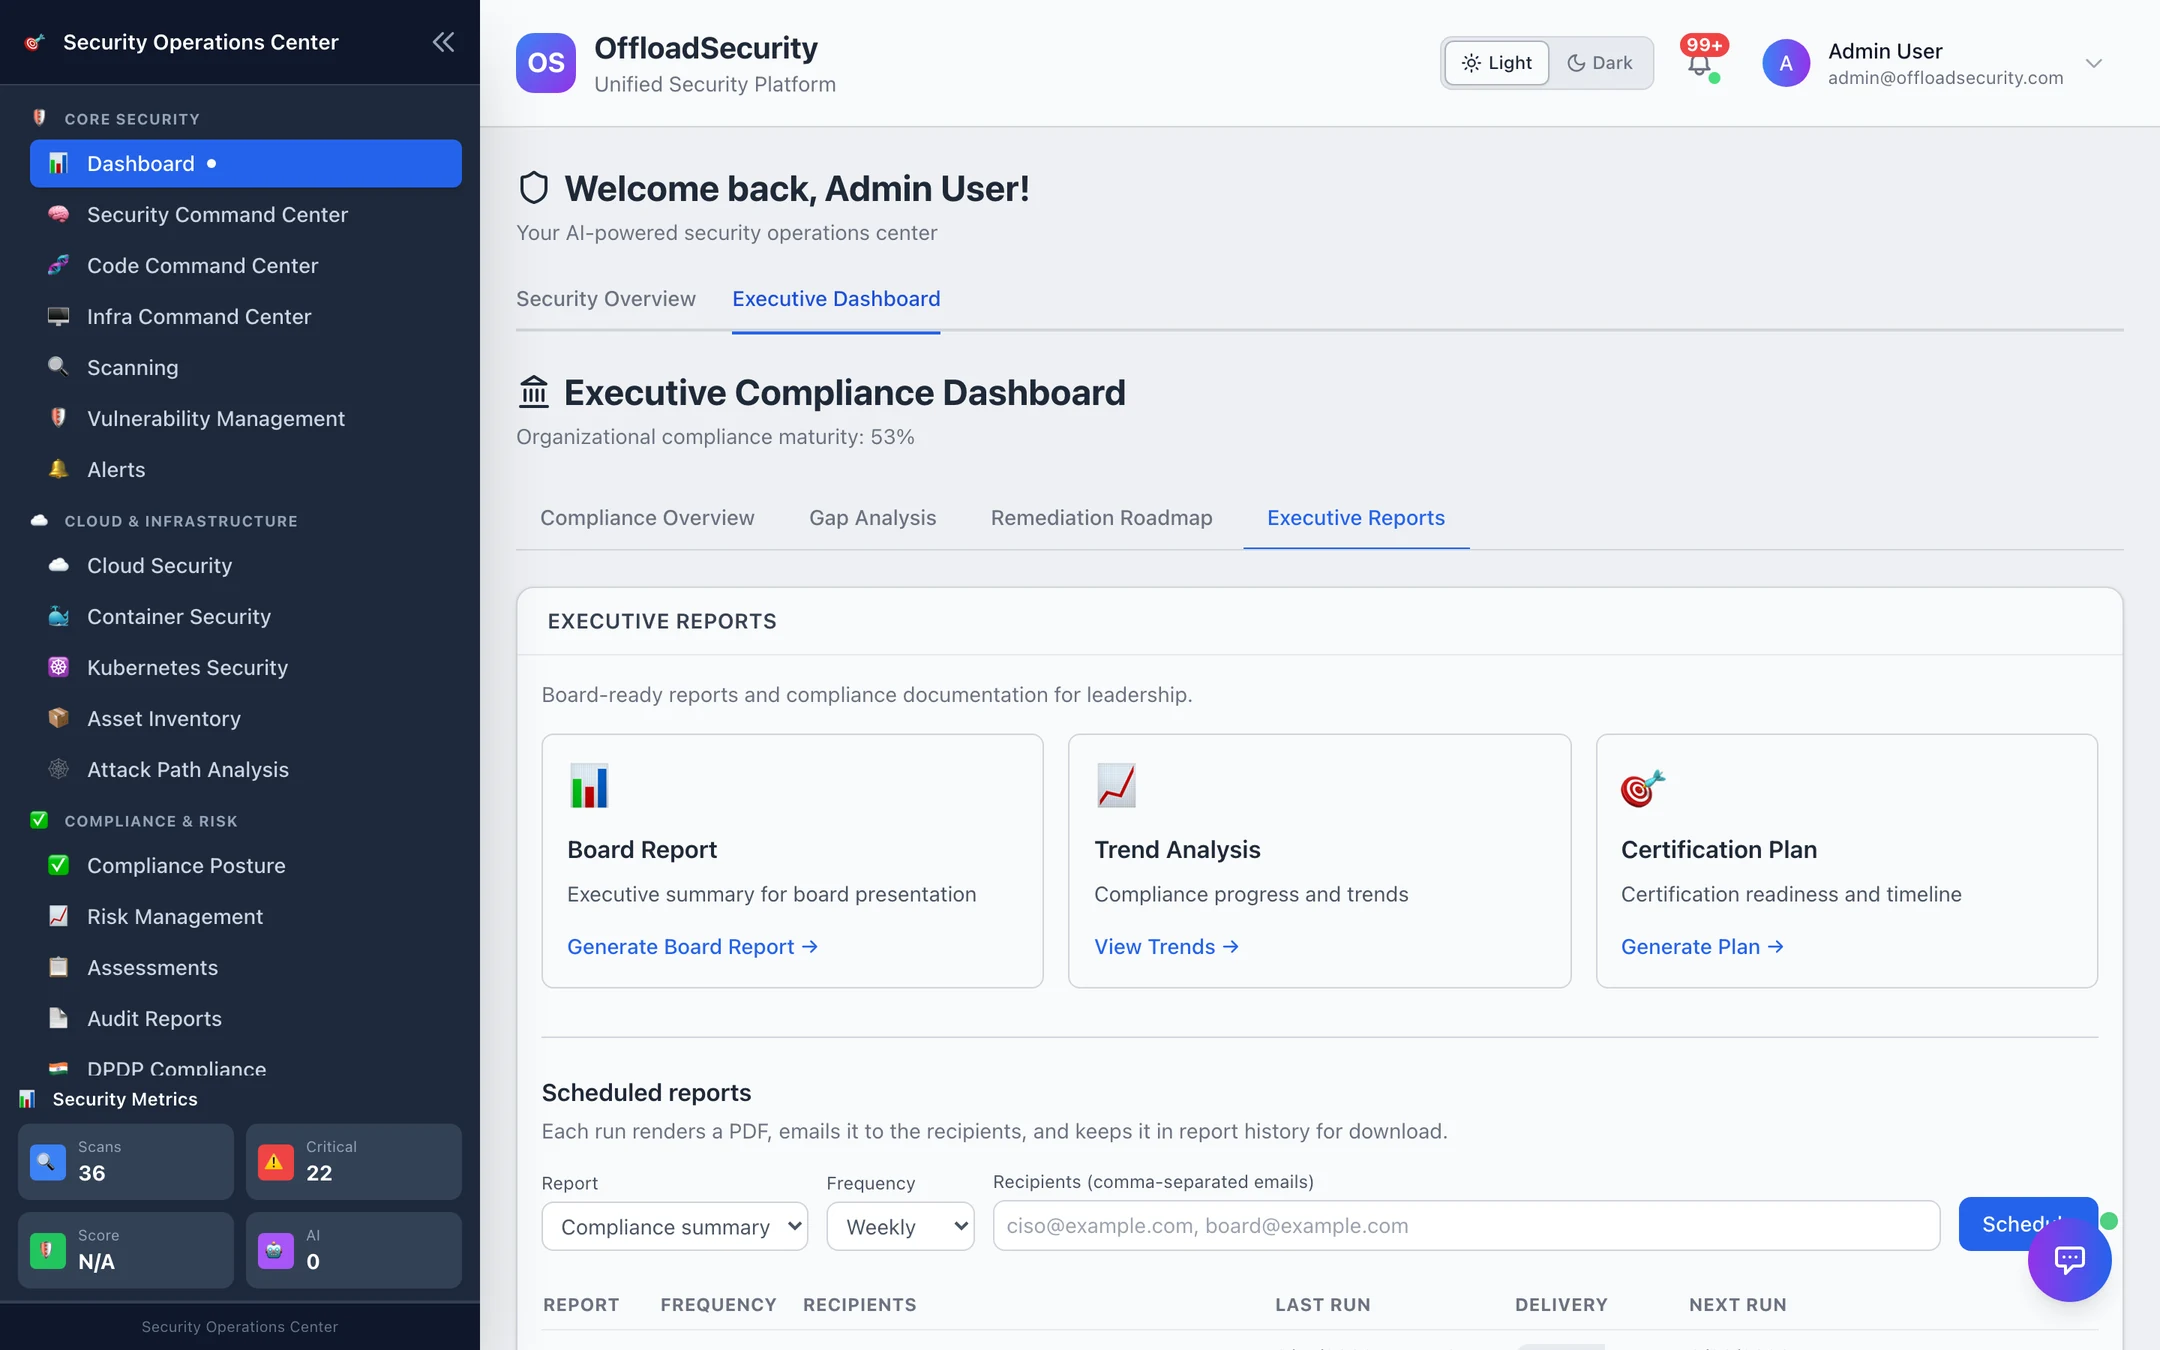
| Report | Content |
|---|---|
| Board Report | Overall maturity, per-framework status, priority gaps, an executive summary and board metrics (trend, gap counts, readiness) |
| Trend Analysis | Compliance metrics over a period (default 90 days, up to 365 over the API) |
| Certification Plan | The roadmap framed as a certification timeline |
Each generates on demand; Export PDF renders the branded Compliance Posture Report — cover and document control, implementation summary, status distribution, and the framework table (implemented / partial / in scope / score) with a bar chart — using the same scorer and the same active frameworks as the dashboard. Generated reports are stored for 180 days.
The Scheduled reports panel on this tab is described on Scheduled Reports.
Permissions
Any authenticated team member can read the overview, metrics and PDF; View Dashboard generates the gap analysis, roadmap and executive reports and updates gap owners, statuses and roadmap progress.
Related
- Compliance Posture — the control-level view behind every card here.
- Audit Reports — the auditor's CSVs rather than the board's PDF.
- Reports & AI API — overview, gap analysis, roadmap, reports and PDF over REST.