Compliance & Fleet Posture
Two tabs turn cluster findings into the views auditors and platform leads ask for: Compliance scores each cluster per framework, and Fleet Heatmap compares all clusters side by side — by severity and by the MITRE ATT&CK tactics your findings map to.
Compliance
Where: Kubernetes Security → Compliance.
How scores are built
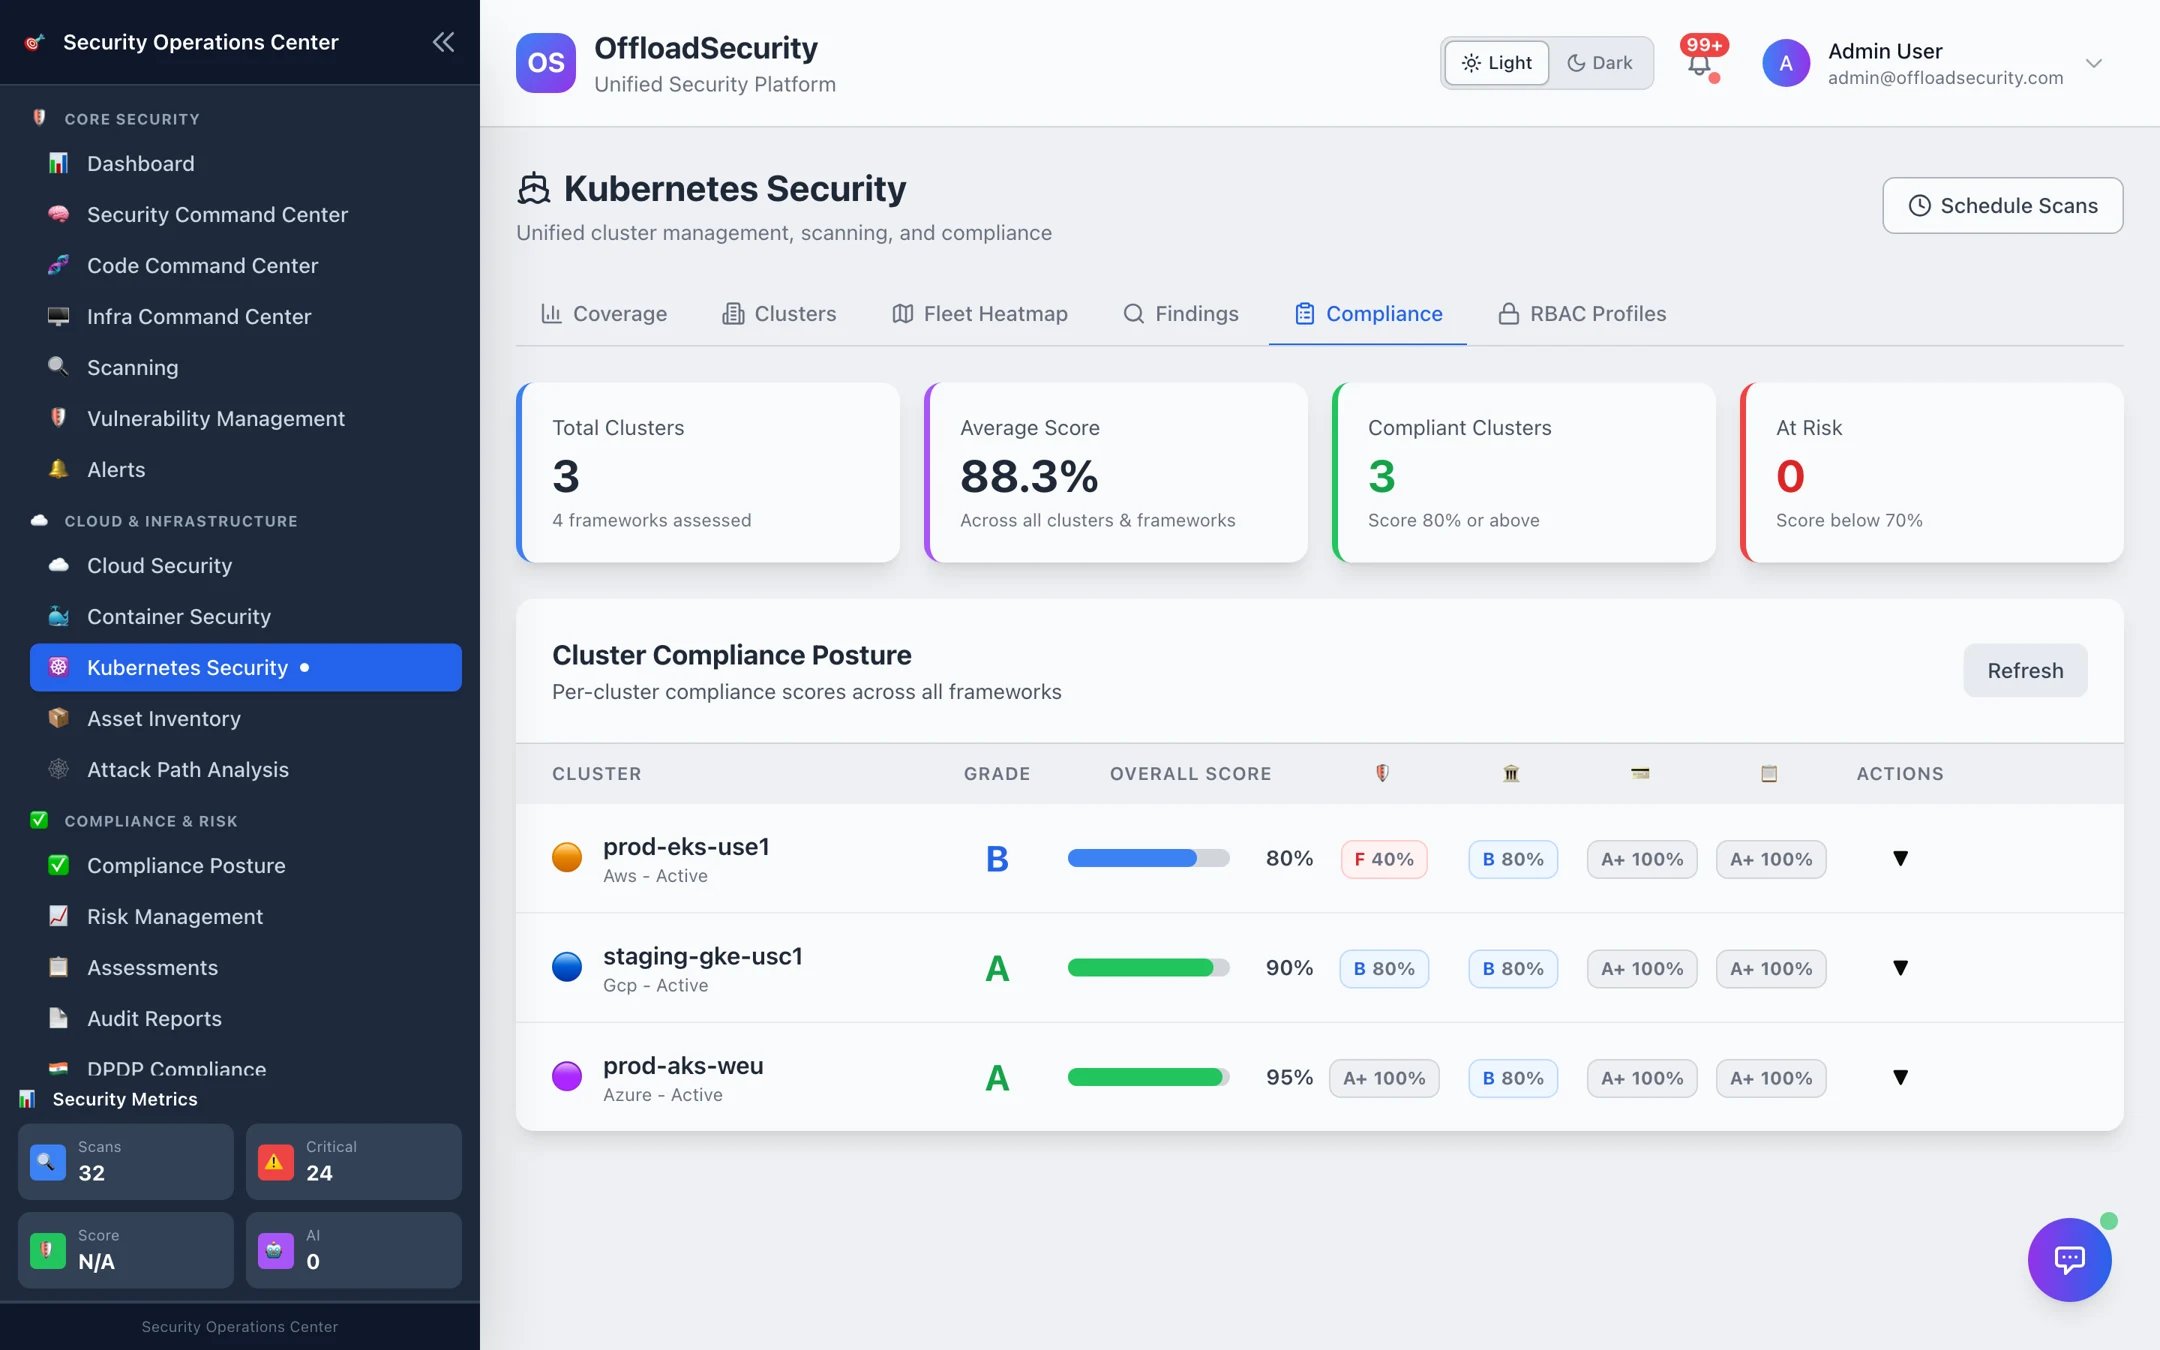
Each engine's checks are mapped to controls in four frameworks — CIS Kubernetes Benchmark, NIST 800-53, PCI DSS and SOC 2 (HIPAA is available on request over the API). For each cluster and framework the platform evaluates the mapped controls against the cluster's open findings: a control passes when no open finding maps to it, fails when a critical/high finding does, and is warned for lower severities. The score is the pass ratio; the overall score is the average across frameworks and drives the letter grade.
| Band | Meaning |
|---|---|
| Compliant | Overall score 80% or above |
| At risk | Below 70% |
Clusters between 70% and 80% count as neither — they are the ones to schedule fixes for before they slip.
A cluster that has never completed a scan is reported as Not Assessed rather than scored — the platform never presents an unscanned cluster as compliant. Scores refresh automatically after each scan; Refresh recomputes on demand.
Reading the table
One row per cluster: provider, grade, overall score, and a score per framework (a ✓ means every mapped control passed). Expand a row's Actions to:
- Generate report for a framework — a structured report with controls total / passed / failed / warned, grouped into the framework's control sections (for CIS: "1.1 Master Node Configuration Files", "5.1 RBAC and Service Accounts", …), each failed control listing the findings behind it.
- Export JSON for evidence or downstream tooling; HTML and PDF renderings are available over the API.
Generate the CIS and SOC 2 reports for each production cluster after the weekly scan and attach them to the control in Evidence Hub. The report carries the scan time and the exact failing findings, which is what auditors ask for.
Fleet Heatmap
Where: Kubernetes Security → Fleet Heatmap.
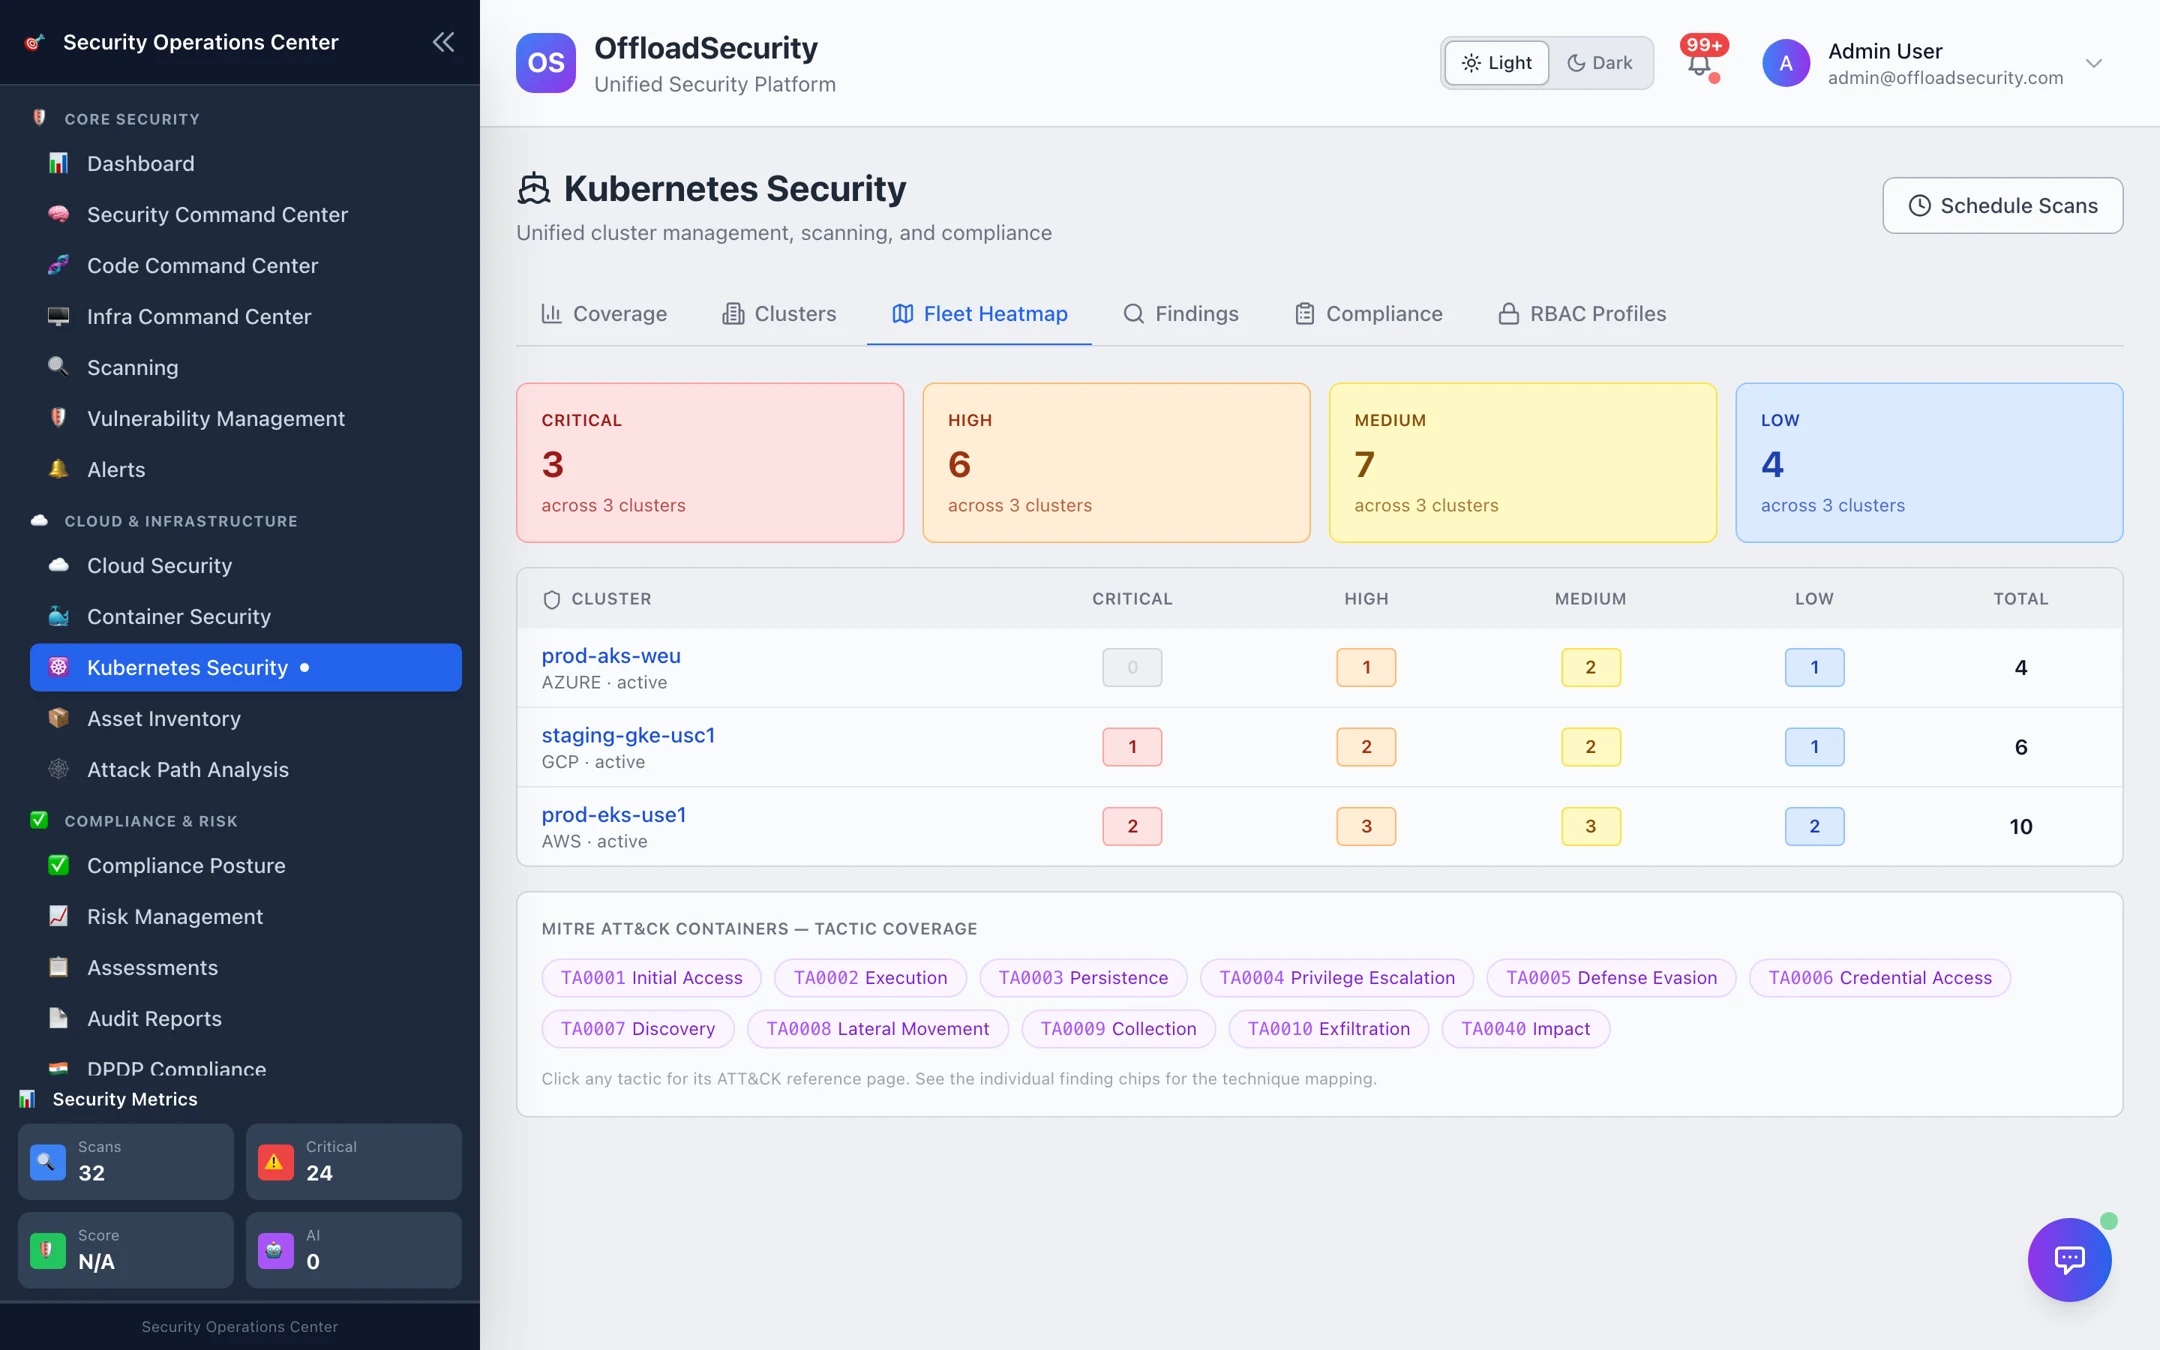
- Severity tiles — critical / high / medium / low totals and how many clusters each affects.
- Cluster matrix — every cluster with its provider and status and the count per severity, sorted so the worst cluster is on top. Select a cluster to jump to its findings.
- MITRE ATT&CK tactic coverage — the eleven tactics in kill-chain order (Initial Access through Impact). A tactic lights up when at least one open finding in the fleet maps to a technique under it, so you can see, for example, that Privilege Escalation and Credential Access are exposed while Exfiltration is not.
Use the heatmap for the weekly platform review: which cluster regressed, which tactic newly lit up, and whether the staging cluster's posture is drifting from production's.
Coverage
The Coverage tab (the landing tab) applies the same coverage model as Cloud Security: clusters scanned, scheduled, not covered, findings by severity, the top clusters by severity, and coverage decay — clusters whose last scan is older than 30 days.
Related
- Scanning & Findings — the findings behind the scores.
- Compliance Dashboard — the organisation-wide framework view that includes Kubernetes controls.
- Scan Management & Scheduling — keep scores current with recurring scans.