Scanning & Findings
A cluster scan runs several engines in one pass and normalises everything they report into findings with a severity, the affected Kubernetes resource, the scanner and check that produced it, and remediation guidance. Findings are deduplicated across runs, so a re-scan updates what you already triaged instead of creating duplicates.
Run a scan
From Kubernetes Security → Clusters, select Scan on a cluster card (or Start Scan from its dashboard). Select several cards to queue a bulk scan. Scans also run on the schedule you set via Schedule Scans (Scan Management & Scheduling) and from the API (POST /api/k8s/scan).
| Engine | What it assesses |
|---|---|
| kube-bench | CIS Kubernetes Benchmark — control-plane, etcd, kubelet and node configuration. |
| Polaris | Workload best practices — resource limits, health probes, security contexts, image tags. |
| Kubescape | NSA-CISA hardening guidance, MITRE ATT&CK and CIS frameworks against live resources. |
| Trivy | Misconfigurations in cluster resources and vulnerabilities in the images they run. |
| kube-hunter | Attack-surface probing of the cluster from the outside. |
All engines run by default; the scan record shows which ones ran. A scan is bounded by a per-scan API-call budget (5,000 calls by default, K8S_SCAN_MAX_API_CALLS) so it is safe to run against large production clusters — a very large cluster is reported as degraded with partial results rather than hammering the API server.
While it runs the card shows Scanning; on completion it shows the finding counts by severity and the last-scanned time.
The cluster dashboard
Select Dashboard on a cluster card for its own view.
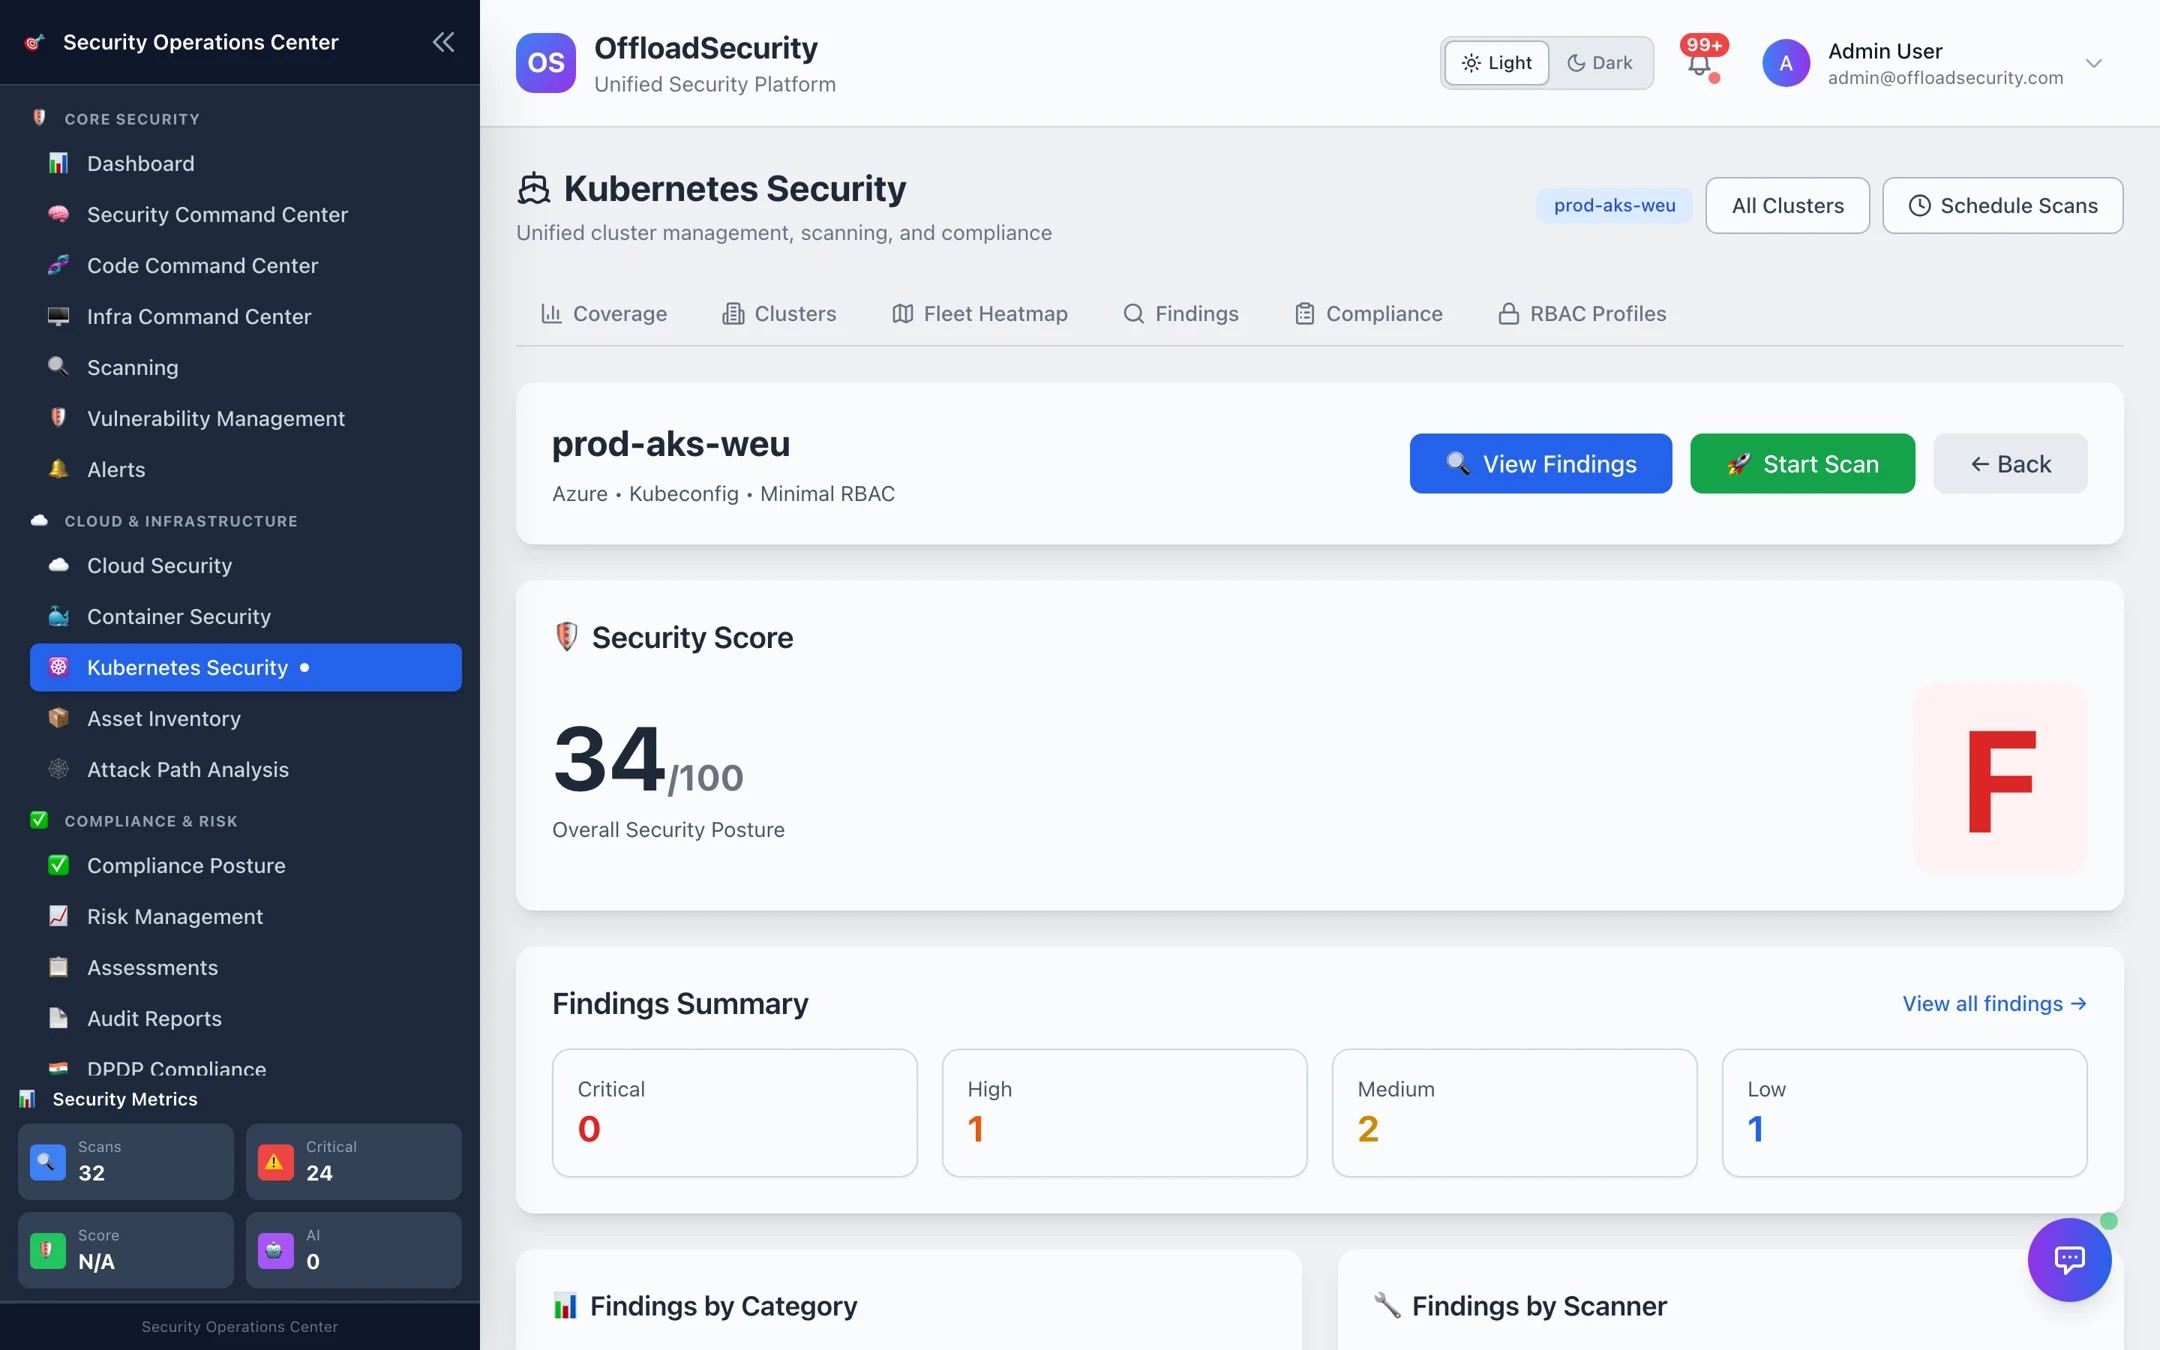
- Security Score (0–100 with a letter grade) — derived from open findings weighted by severity; it moves as you remediate and is Not Assessed until the first scan completes.
- Findings Summary — open findings by severity, with View all findings jumping to the Findings tab pre-filtered to this cluster.
- Findings by Category and by Scanner — where the risk sits (RBAC, workloads, network, control plane) and which engine reported it.
- Start Scan and Back to the fleet.
Working the findings
Kubernetes Security → Findings lists every finding across your clusters.
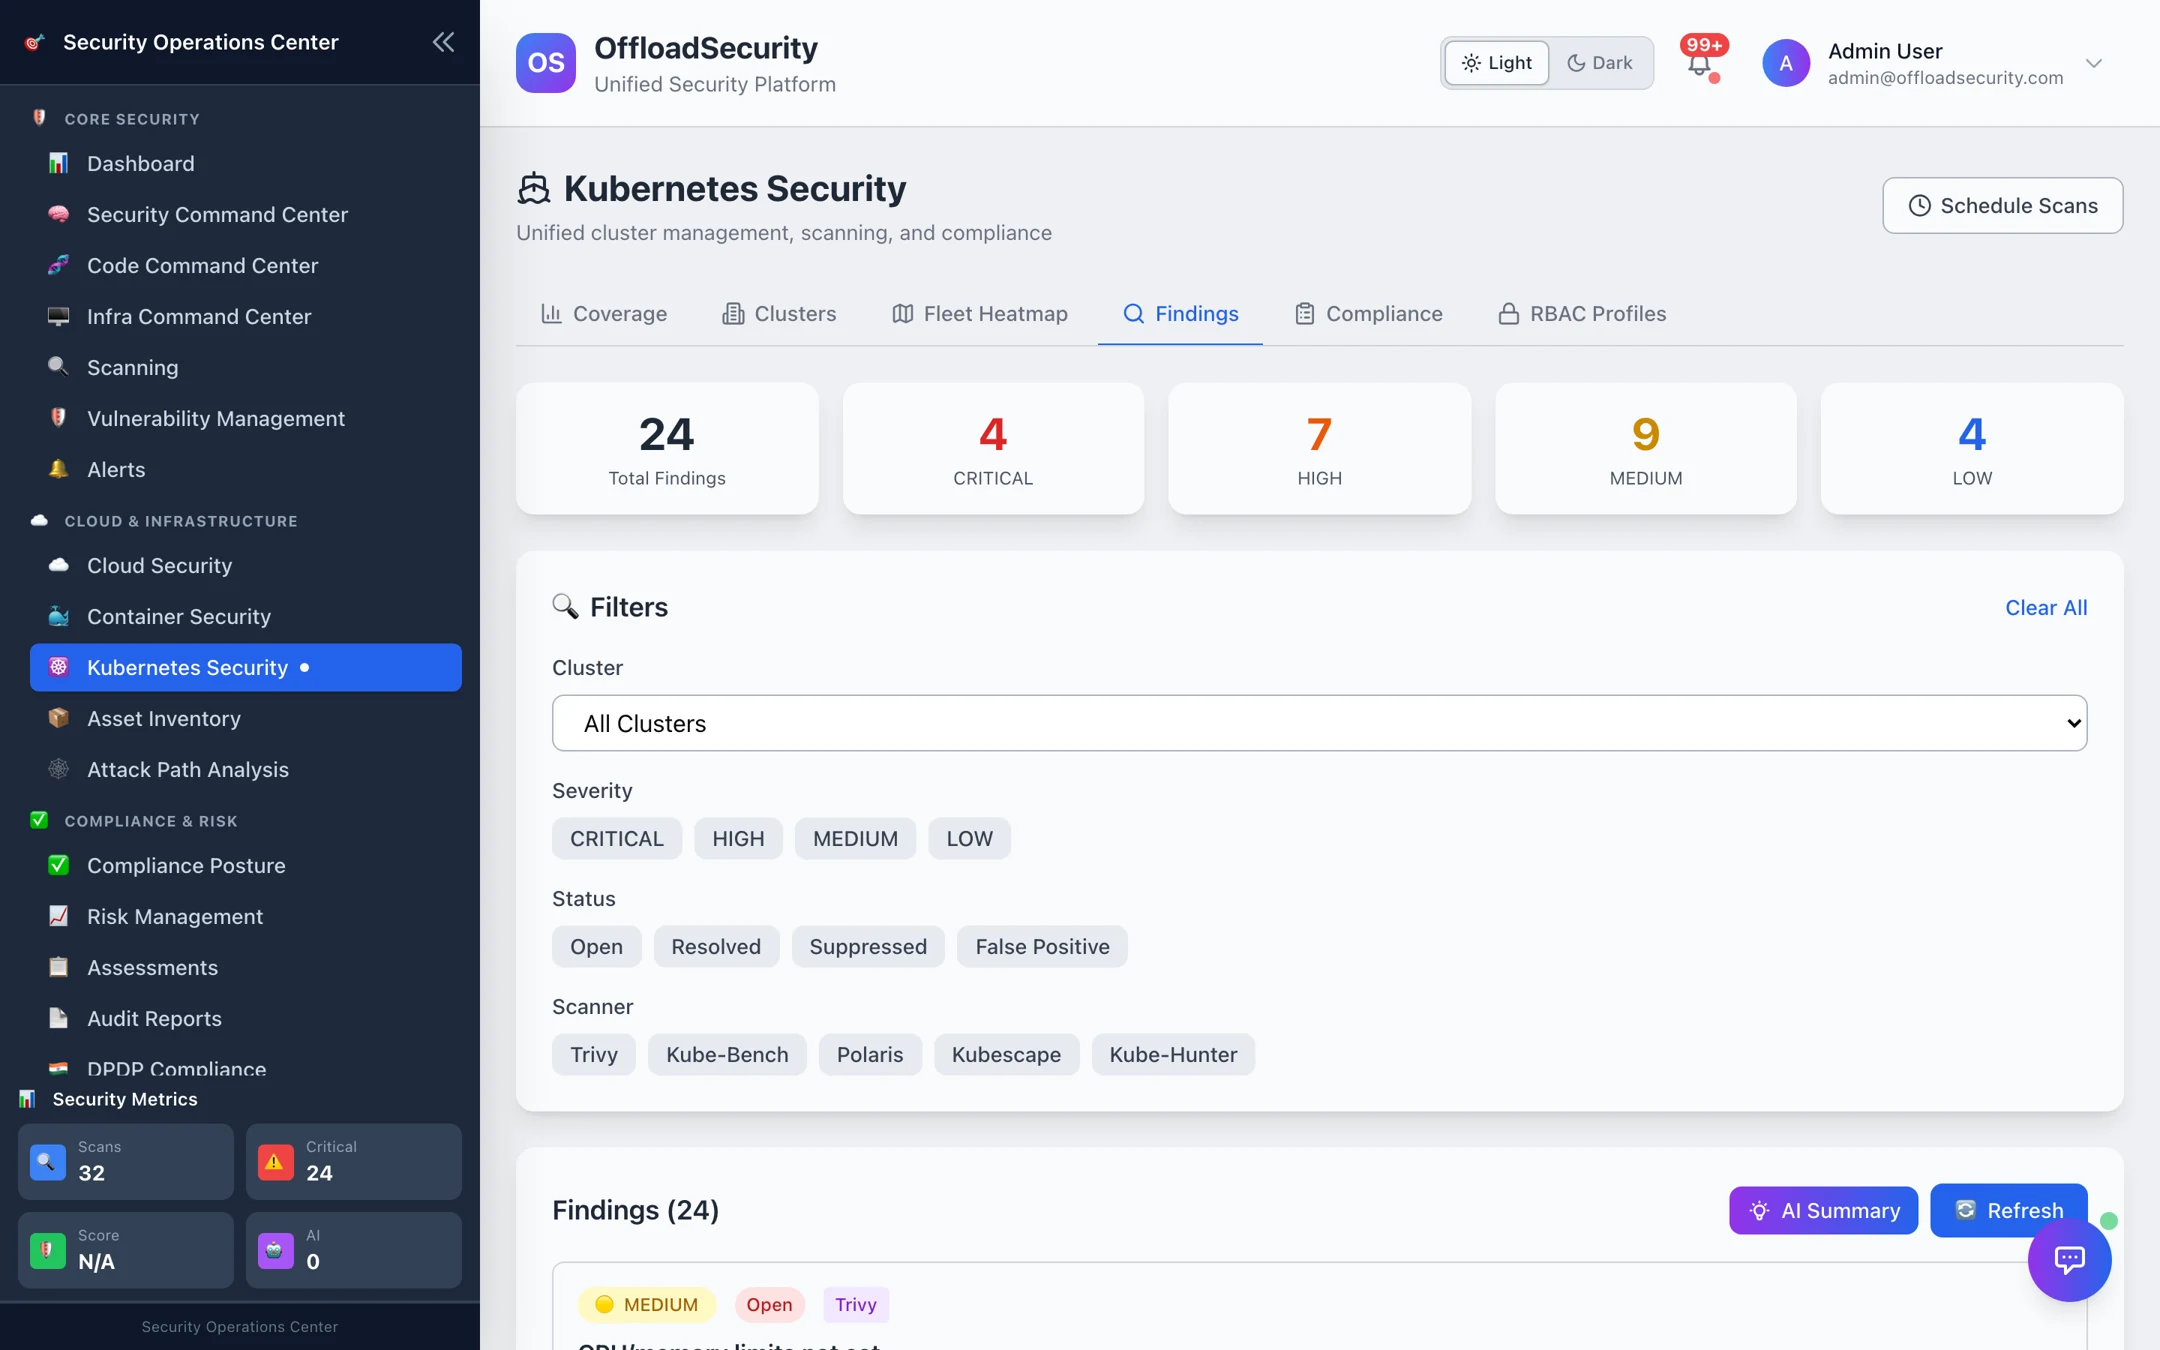
Filter by cluster, severity, status (Open, Resolved, Suppressed, False positive) and scanner; the tiles above update to the filtered set. AI Summary produces a short narrative of what matters most in the current view.
Each finding shows the severity, scanner, check ID, the resource (kind, name, namespace), first and last seen, a description and the remediation. Open one for the full detail, then act:
| Action | Result |
|---|---|
| Resolve | Marks it resolved. If the next scan still reports the check on that resource the finding reopens — a resolve is a claim the next scan verifies. |
| Suppress | Hides it with a required reason, recorded with who suppressed it and when. Use for accepted risk (for example a system namespace you do not control). |
| False positive | Records that the check does not apply; kept out of scores and reports. |
| Reopen | Returns a non-open finding to open. |
Sort the fleet by score (Fleet Heatmap) and work the critical findings of the lowest-scoring production cluster first. Most Kubernetes criticals are a handful of root causes — privileged pods, cluster-admin bindings, public API endpoints — that clear many findings at once.
What happens between scans
- New failures open as findings with first seen; findings that disappear from a scan are auto-resolved; resolved-but-still-failing findings reopen.
- Your suppressed and false positive decisions persist across re-scans.
- Findings feed the cluster's compliance scores (Compliance & Fleet Posture), Vulnerability Management, and the security graph used by Attack Path Analysis.
Related
- Onboarding Clusters — before the first scan.
- Compliance & Fleet Posture — scores, heatmap, reports.
- Scanning API — scan, poll and list findings over REST.