Risk Appetite, KRIs & Scenarios
These three tools turn the register from a list into governance: appetite says what is acceptable, KRIs watch whether you are drifting toward the limit, and scenarios test what a bad week would do to a risk before it happens. All three live under Risk Management → More.
Risk appetite
Where: Risk Management → More → Risk Appetite.
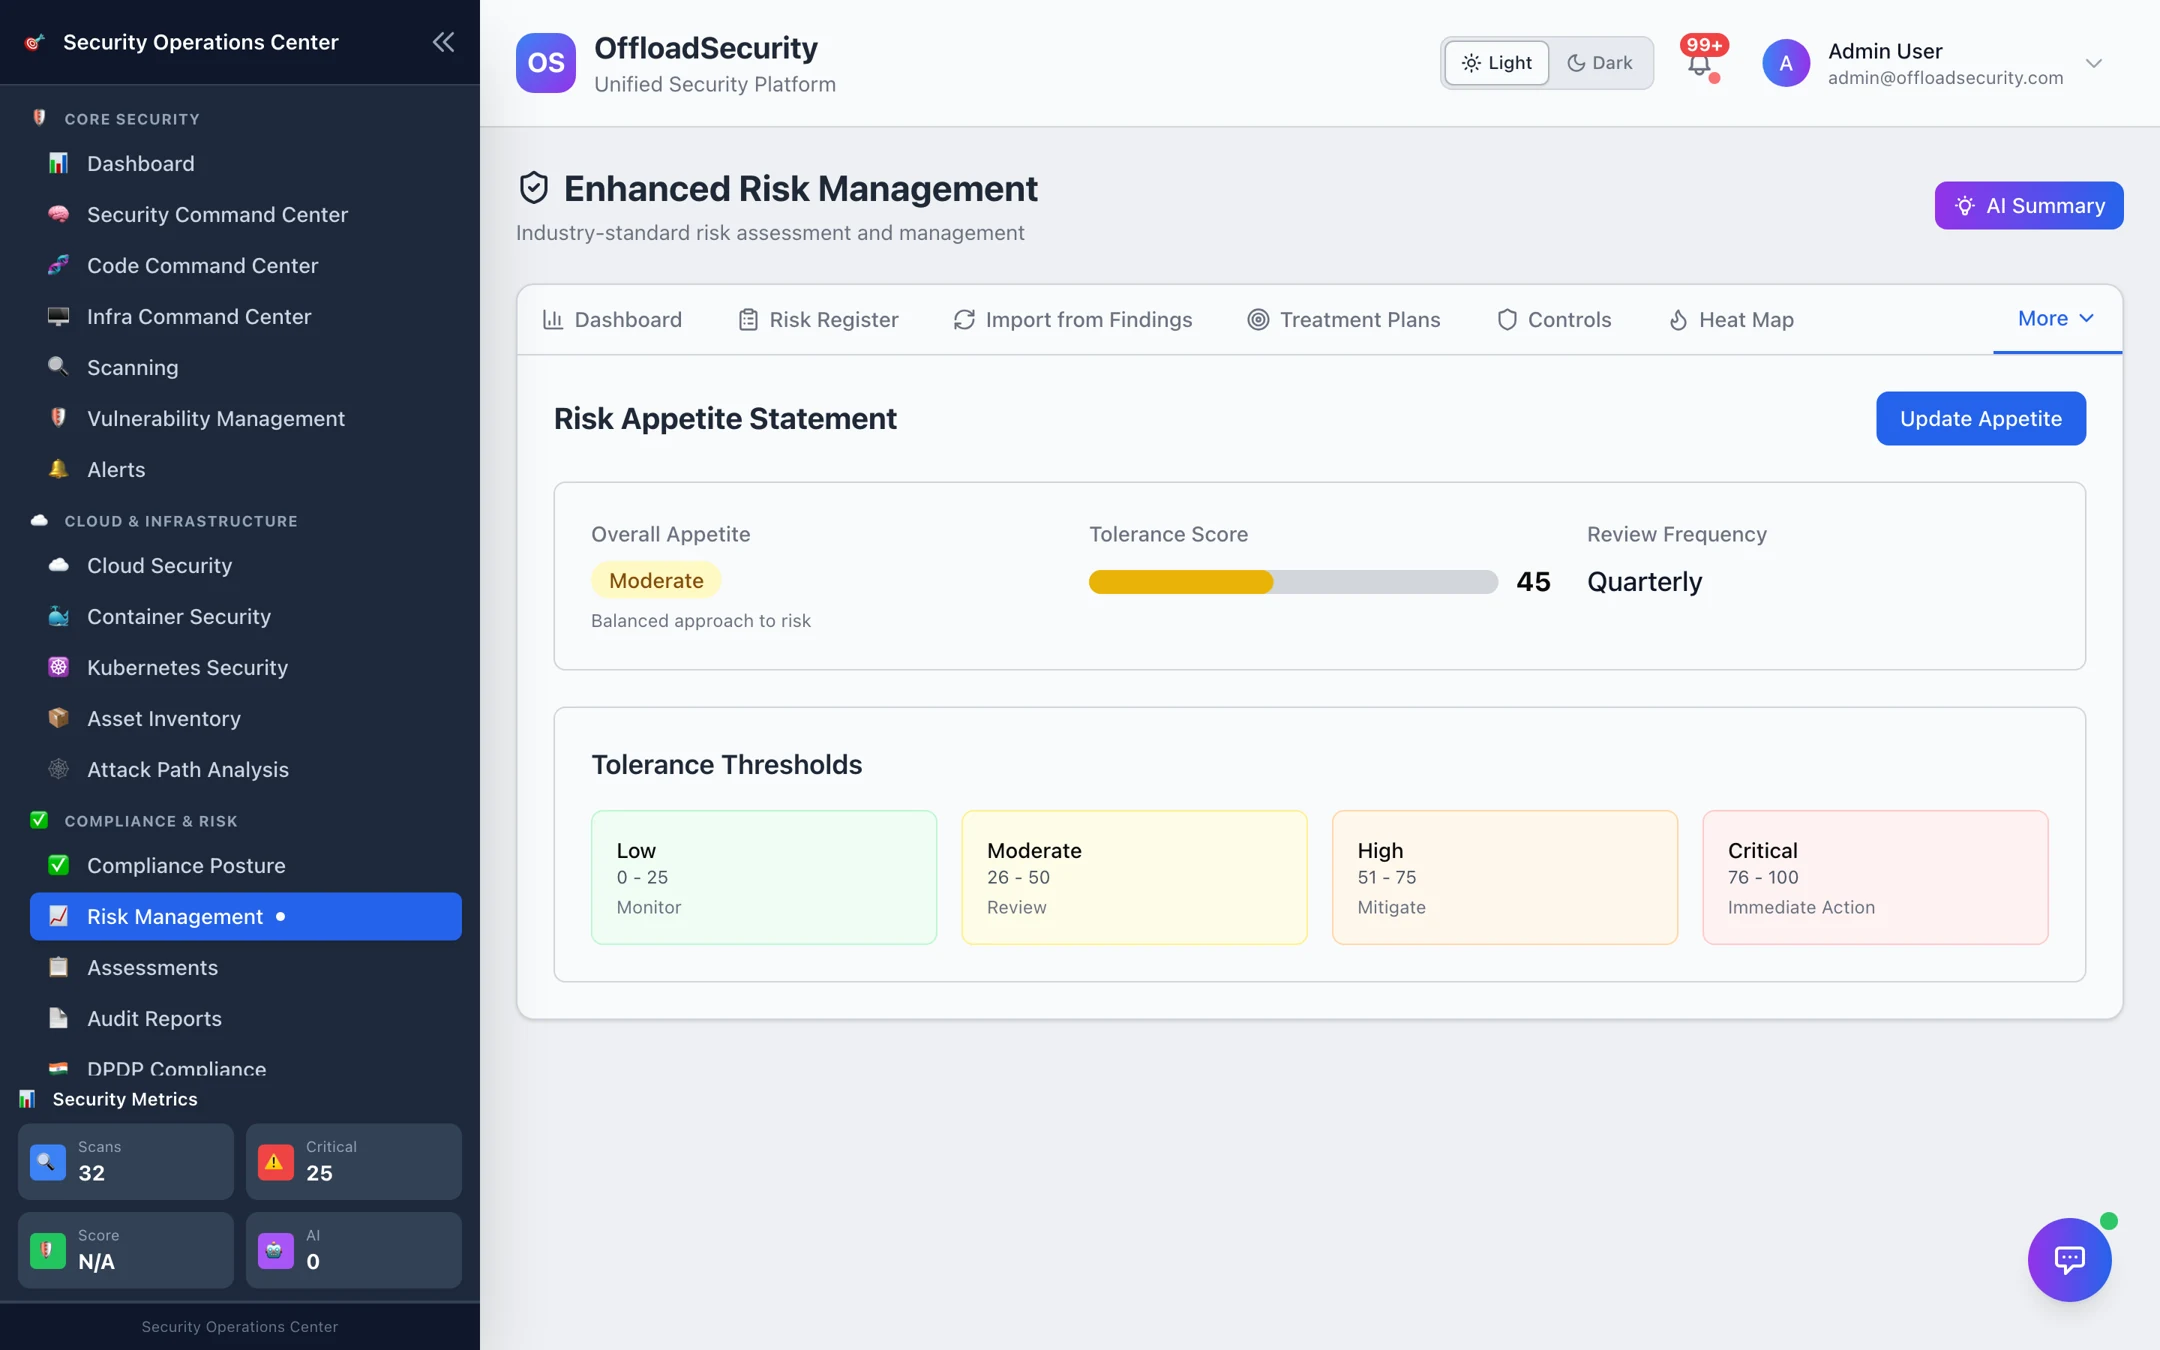
The appetite statement records:
| Element | Meaning |
|---|---|
| Overall appetite | Conservative, moderate or aggressive, with an overall tolerance score — the maximum acceptable risk score |
| Category appetites | Per category (security vulnerability, cloud security, compliance, operational, …): an appetite level, a tolerance score and the rationale — e.g. low for the PCI-scoped payments platform, moderate for non-production |
| Tolerance thresholds | The score bands — low / moderate / high / critical — with the action required at each (monitor, review, mitigate, immediate action) |
| Review frequency and approval | How often the statement is revisited and who approved it |
Once saved, the Dashboard's appetite overlay draws the thresholds on the heat map and the appetite check flags risks whose current score exceeds their category's tolerance — the list to bring to the risk committee. Update Appetite edits the statement.
Key risk indicators
Where: Risk Management → More → KRIs.
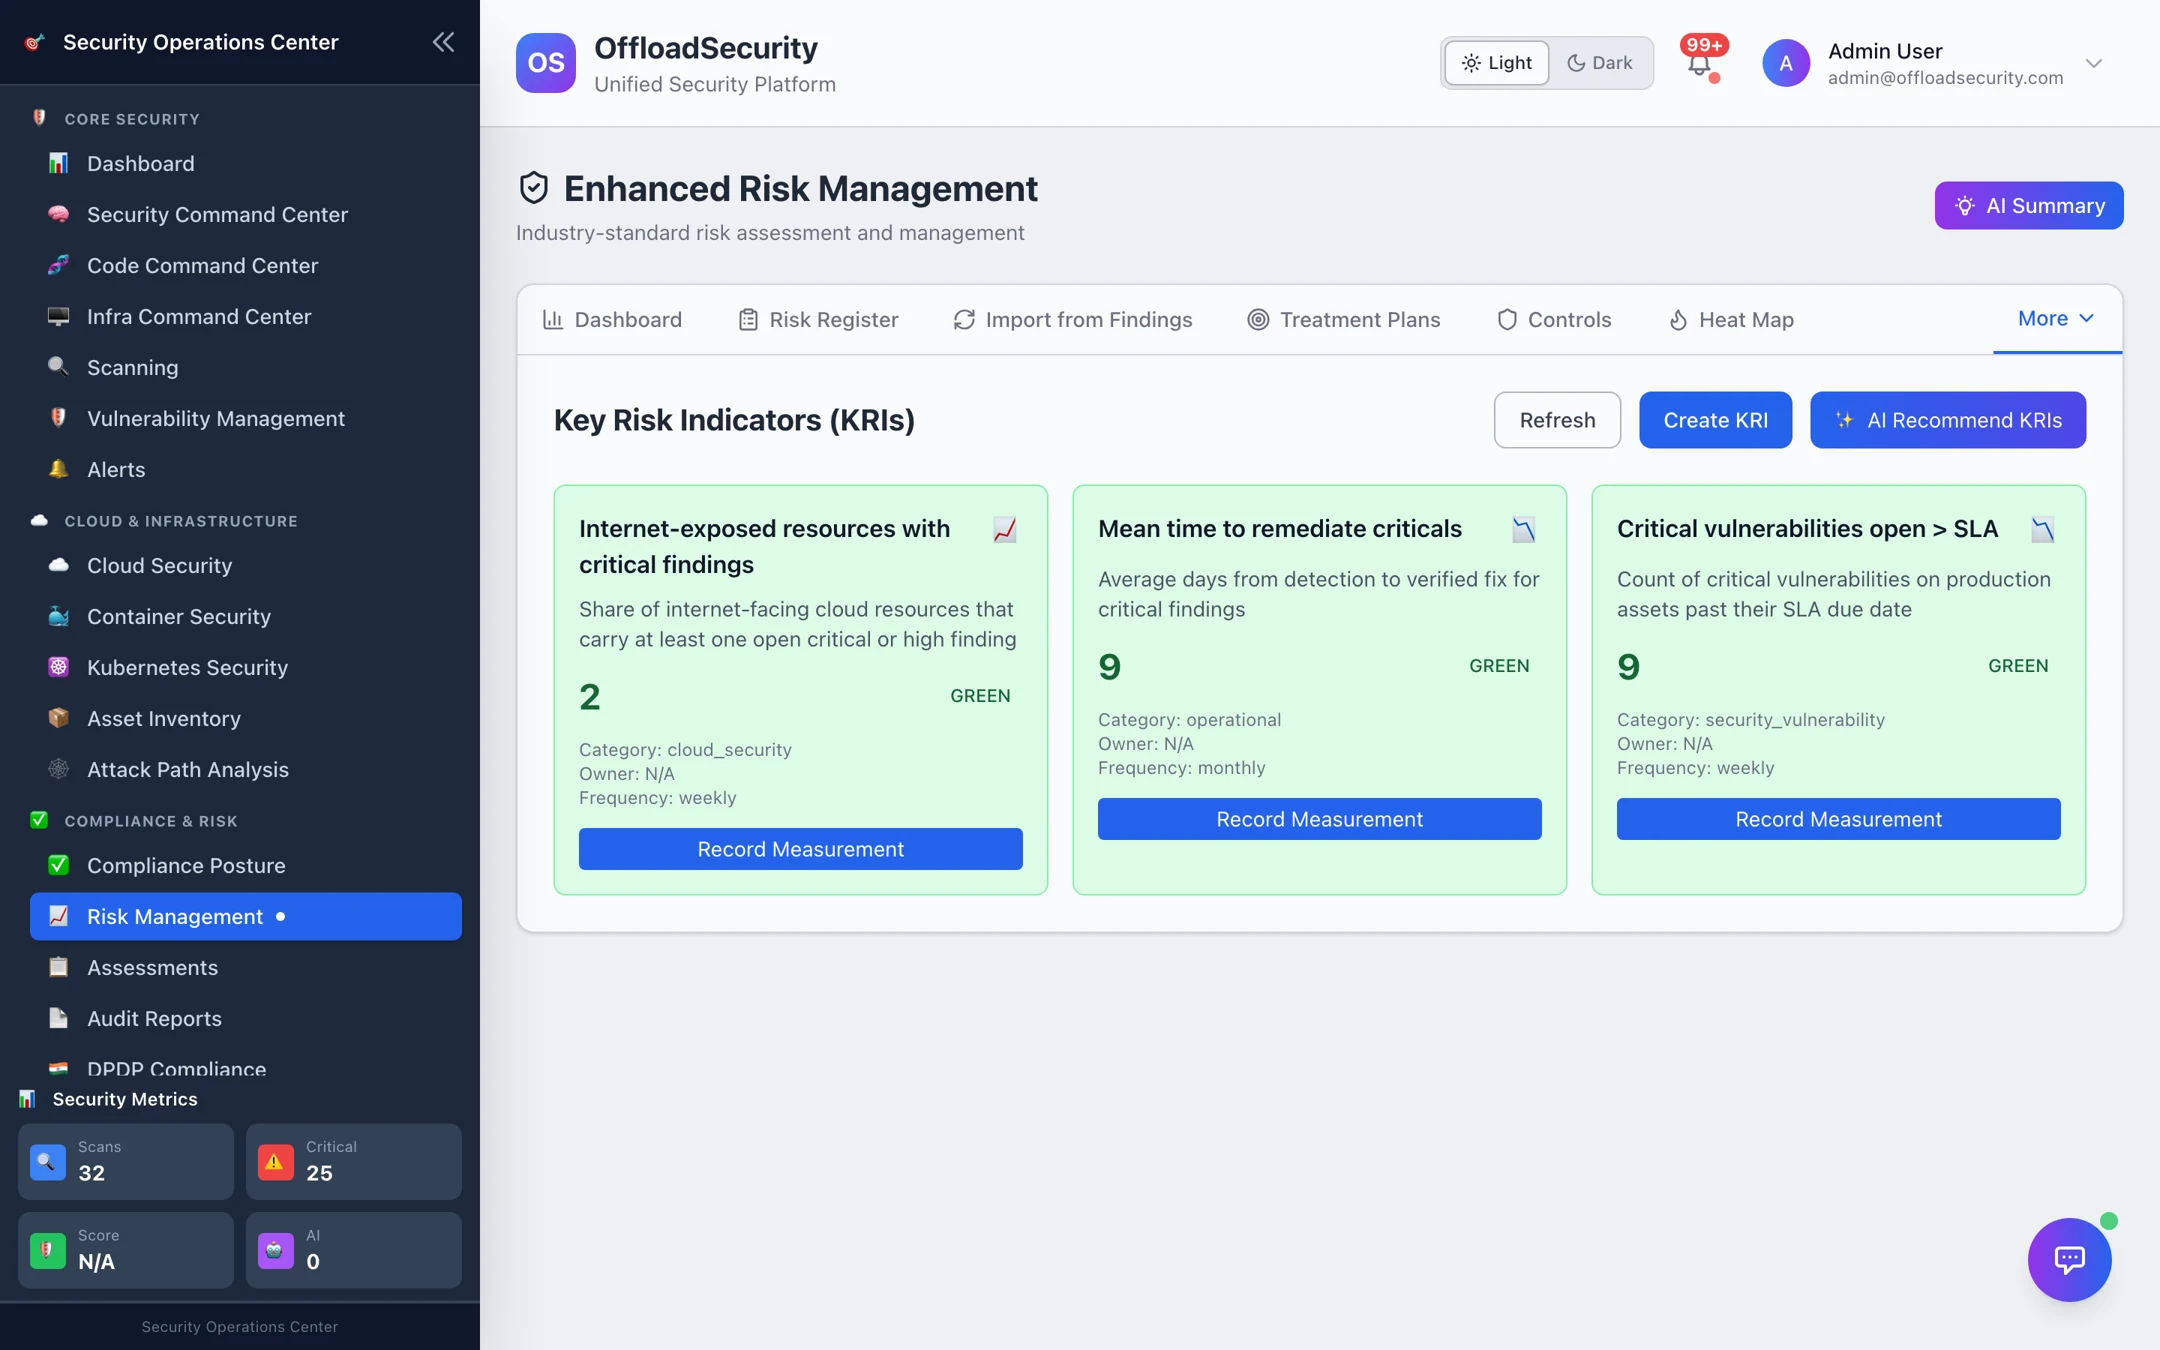
A KRI is a metric that warns before a risk materialises. Define it with a name, category, metric type (count, percentage, currency, ratio, score) and unit, a measurement frequency (daily → quarterly), its data source and calculation, the risks it is linked to, and thresholds: green_max, amber_max, red_max (and optionally critical_max). By default higher is worse; set the direction to lower is worse for indicators such as patch coverage.
Record Measurement adds a value; the KRI's status becomes green / amber / red / critical from the thresholds, and the Dashboard's KRI health and the KRI status distribution roll them up. AI Recommend KRIs proposes indicators for your register's categories.
Critical vulnerabilities open past SLA (count, green = 0), internet-exposed resources with a critical/high finding (percentage), and mean time to remediate criticals (days). All three can be measured from data the platform already has.
Scenarios
Where: Risk Management → More → Scenarios.
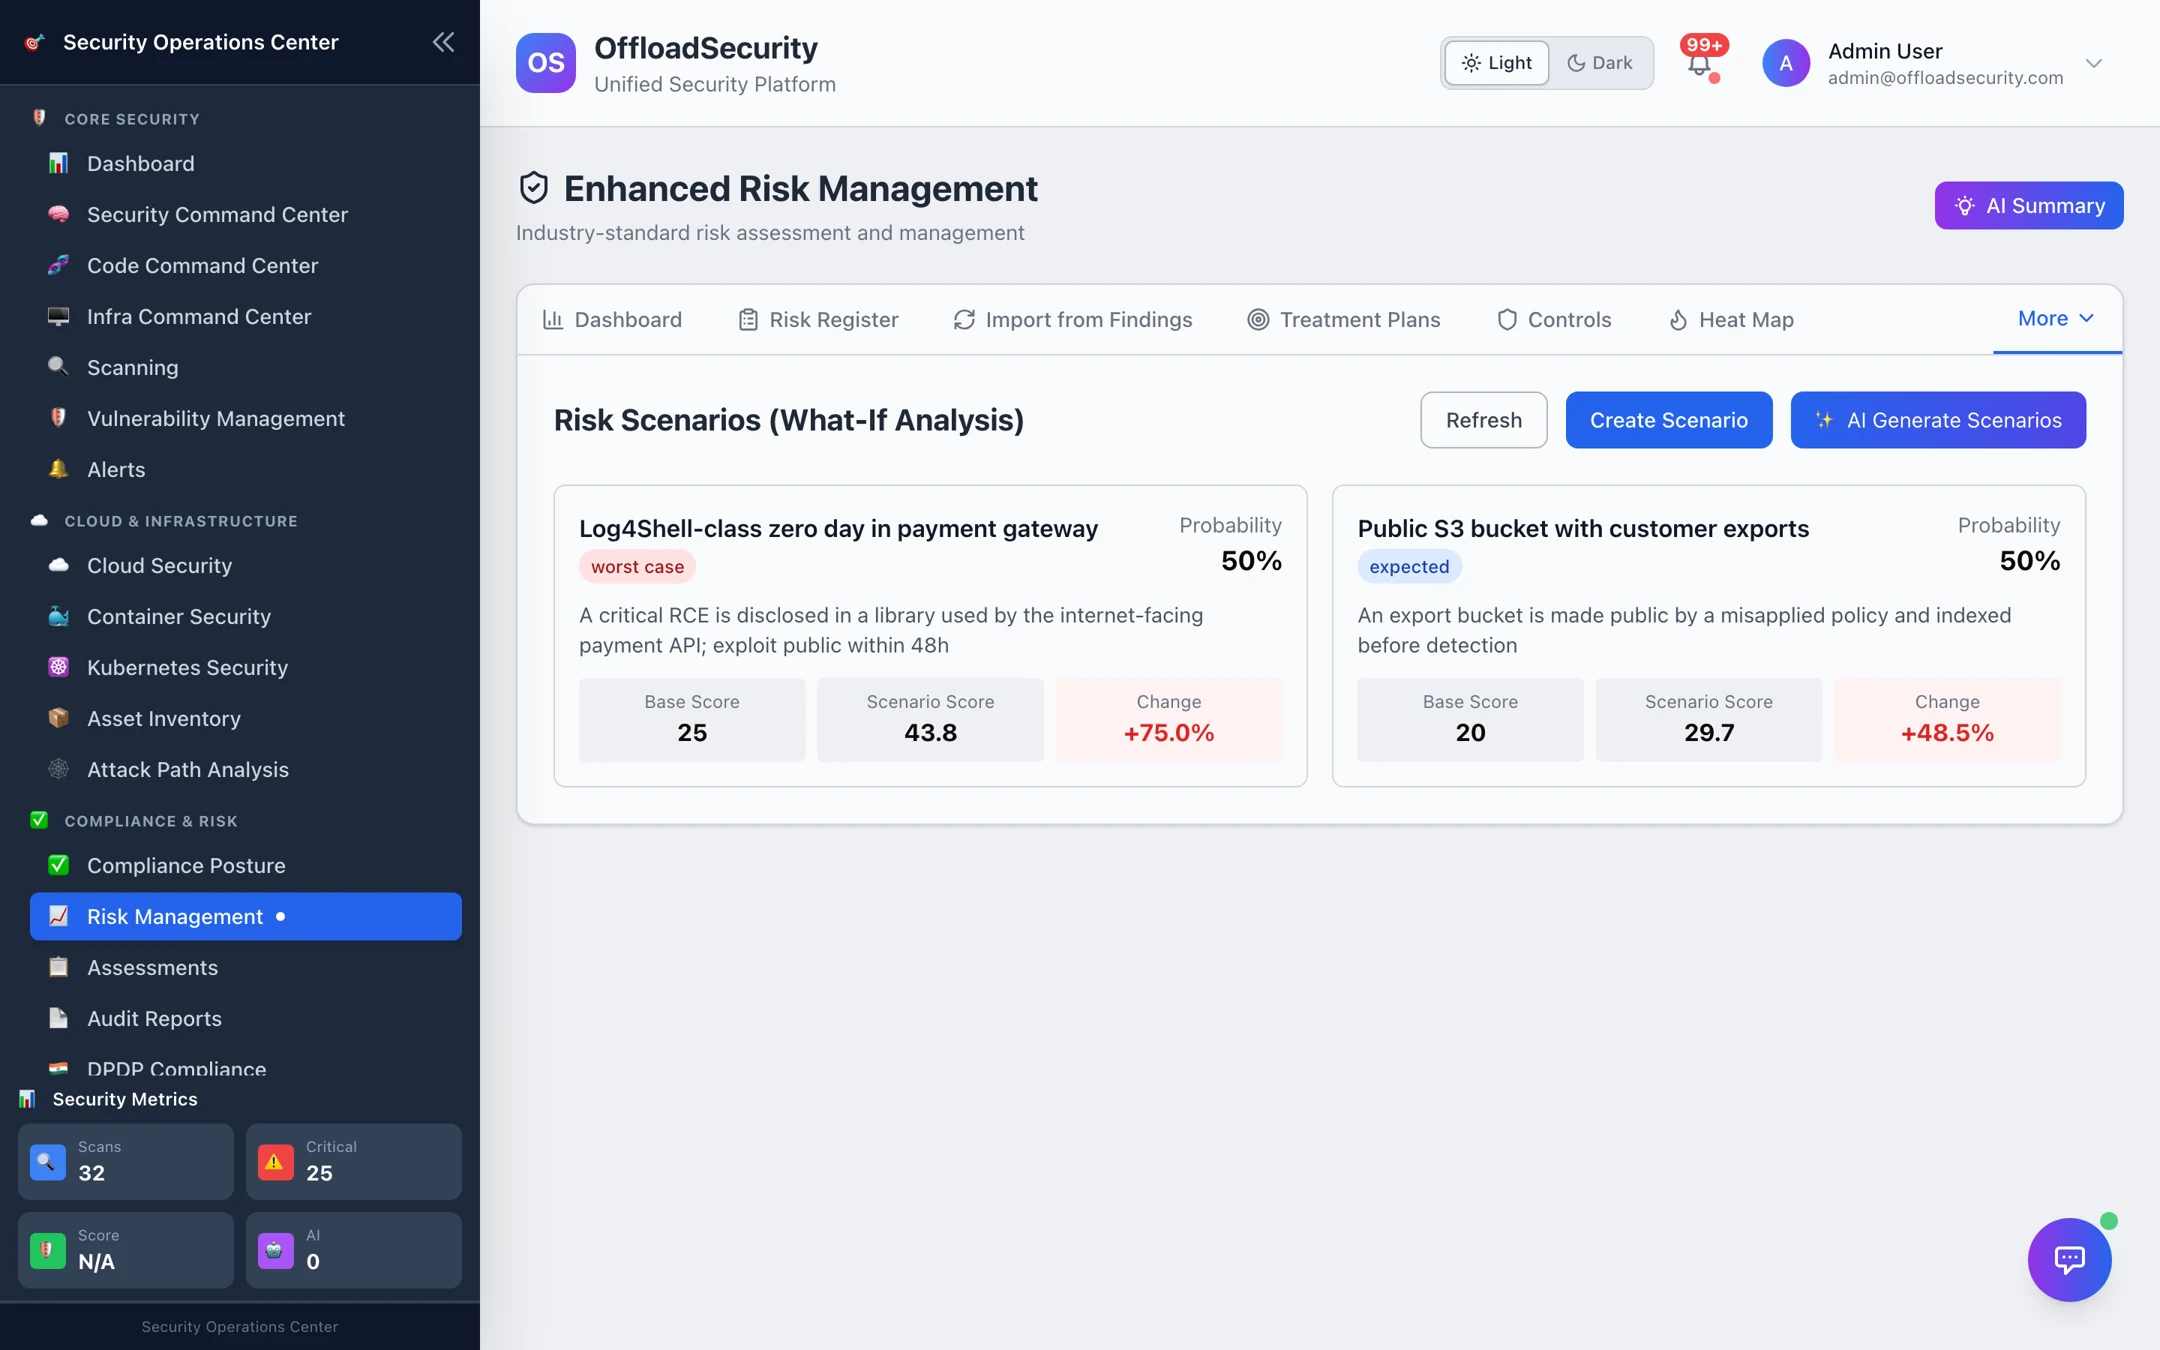
A scenario is a what-if on one risk: choose the type — best case, expected, worst case, stress test — describe it, set a likelihood adjustment and impact adjustment (percent), and add parameters (time to patch, exposed endpoints, detection hours) for the record. The platform computes the scenario risk score against the base score and the change, so you can show what a zero-day in the payment gateway does to your posture, or how much a faster detection time buys. AI Generate Scenarios drafts a set for a selected risk.
Related
- Risk Register — the risks these govern.
- Treatment & Controls — bringing a risk back within appetite.
- Vulnerabilities & Risk API — appetite, KRIs, measurements and scenarios over REST.