Treatment Plans, Controls & Heat Map
A risk in the register is a statement of a problem. A treatment plan is the decision about it, controls are what actually reduces it, and the heat map is where the register is seen at a glance.
Treatment plans
Where: Risk Management → Treatment Plans.
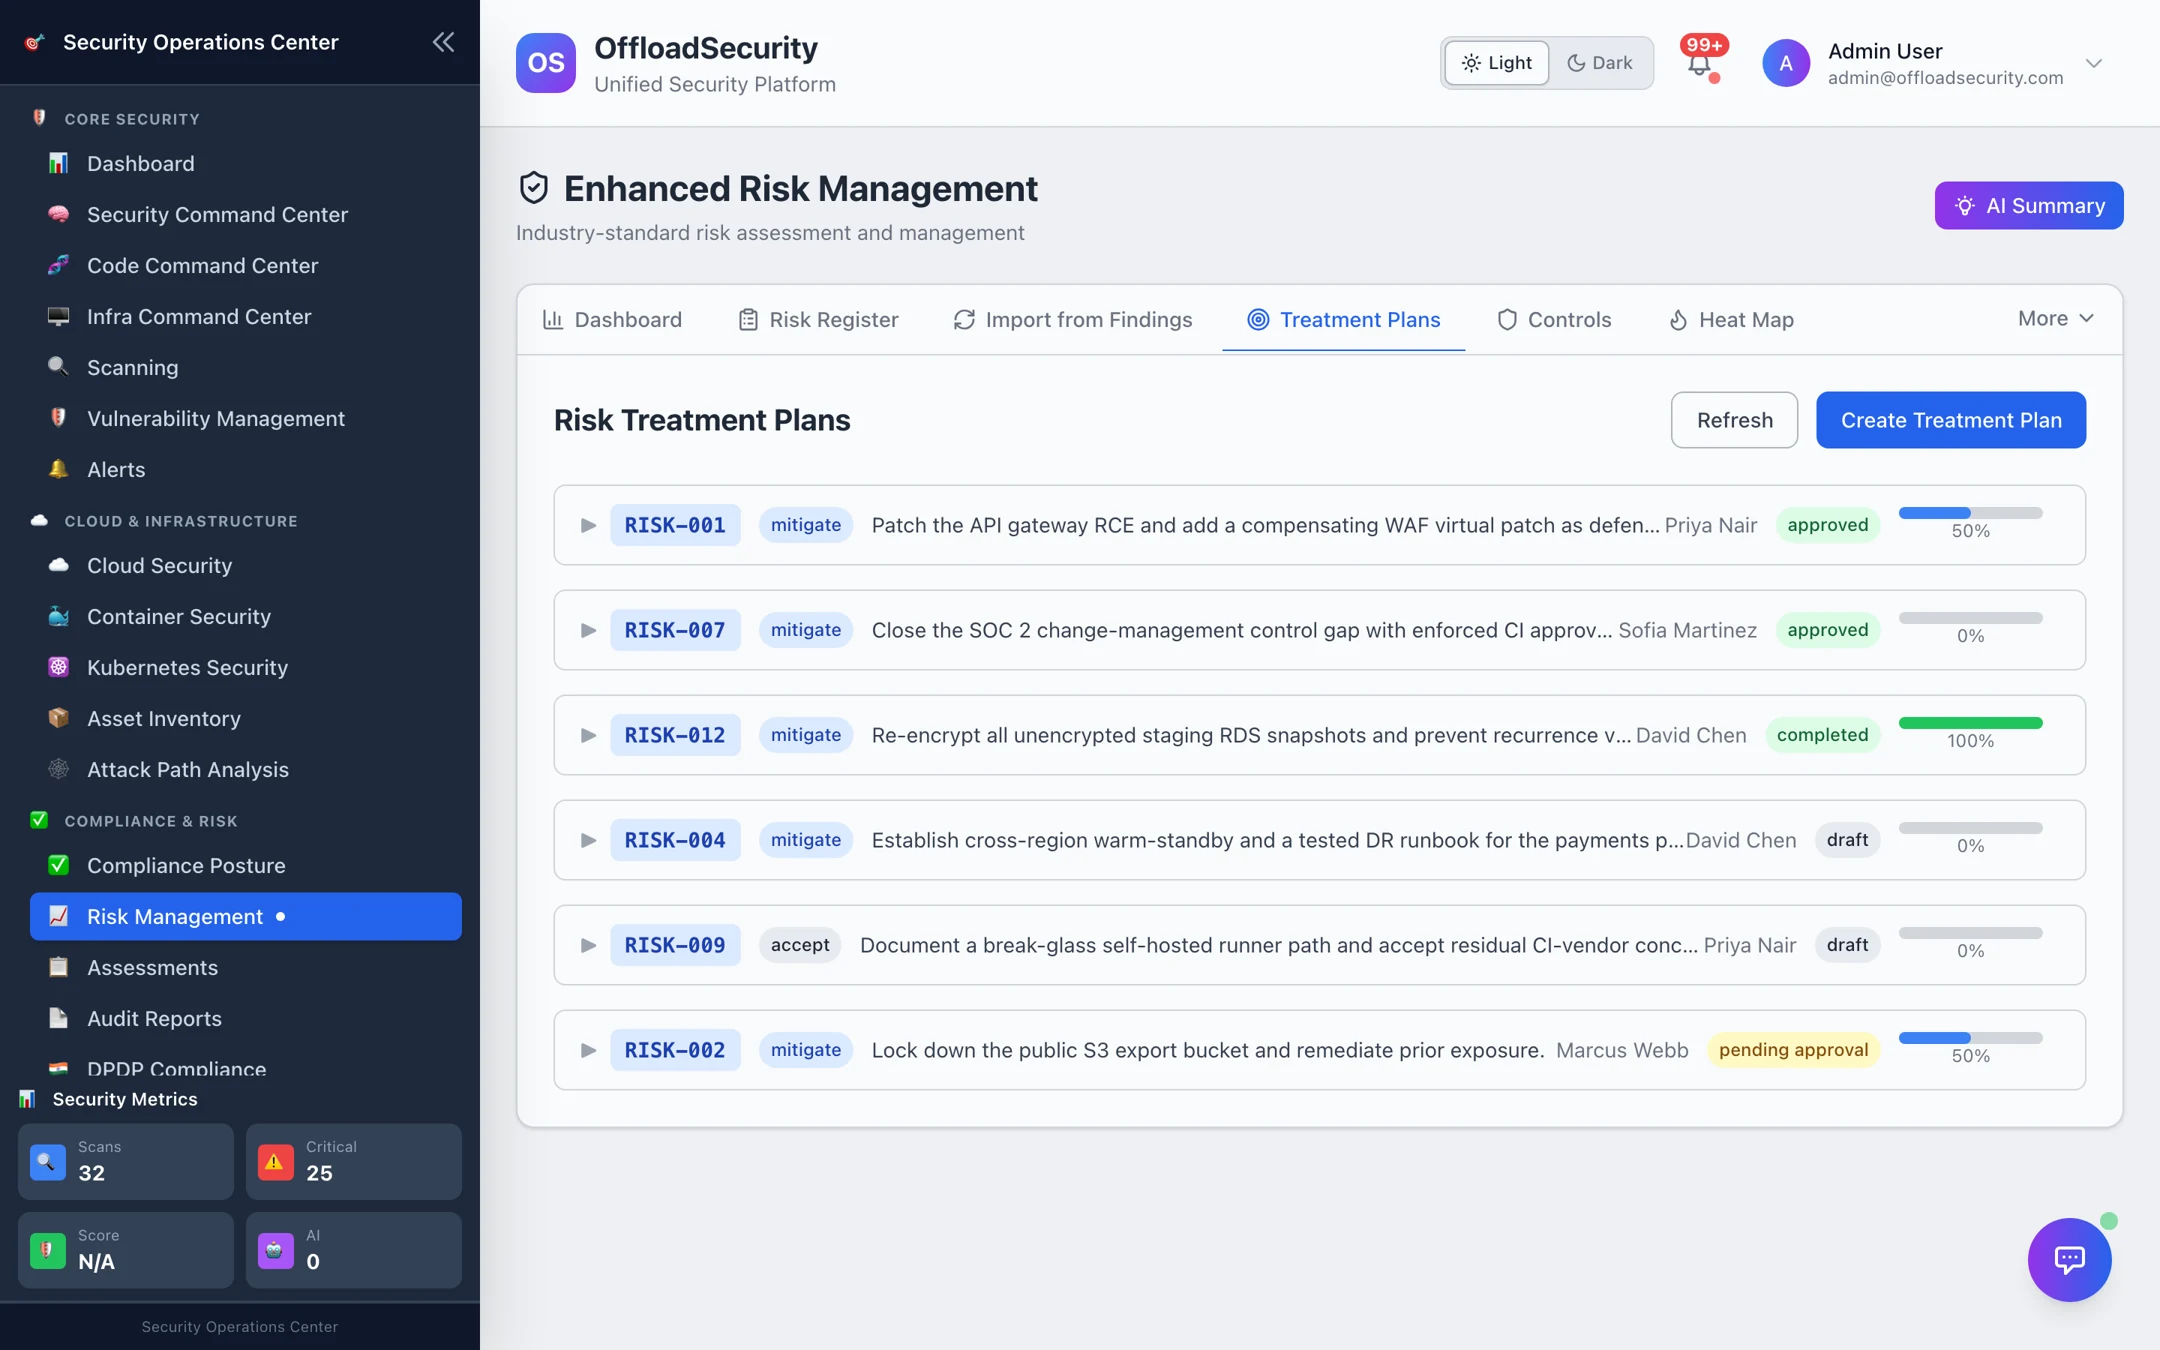
Each plan applies one strategy to one risk:
| Strategy | Meaning | Typical use |
|---|---|---|
| Mitigate | Reduce likelihood or impact with actions and controls | Most technical risks |
| Accept | Live with it, documented and time-boxed | Low residual risk, or cost of fixing exceeds impact |
| Transfer | Move the impact to a third party (insurance, contract) | Financial and third-party risks |
| Avoid | Stop the activity that creates the risk | Decommissioning, not launching |
| Share | Split it with a partner | Joint ventures, shared platforms |
A plan carries action items (each with an owner, a due date and a status), an expected residual risk, a financial impact estimate, and a progress percentage computed from its actions.
Approval workflow
| Plan status | How it gets there |
|---|---|
| draft | Created; actions can be added |
| pending_approval | Submit for approval (only drafts and rejected plans can be submitted) |
| approved / rejected | An approver decides under Pending Approvals on the Dashboard; a rejection returns the plan to editable |
| in_progress | Work has started on the actions |
| completed | All actions done — the plan's expected residual risk becomes the risk's baseline |
| on_hold | Paused |
The workflow gives auditors what they ask for: who approved accepting a critical risk, and when.
Controls
Where: Risk Management → Controls.
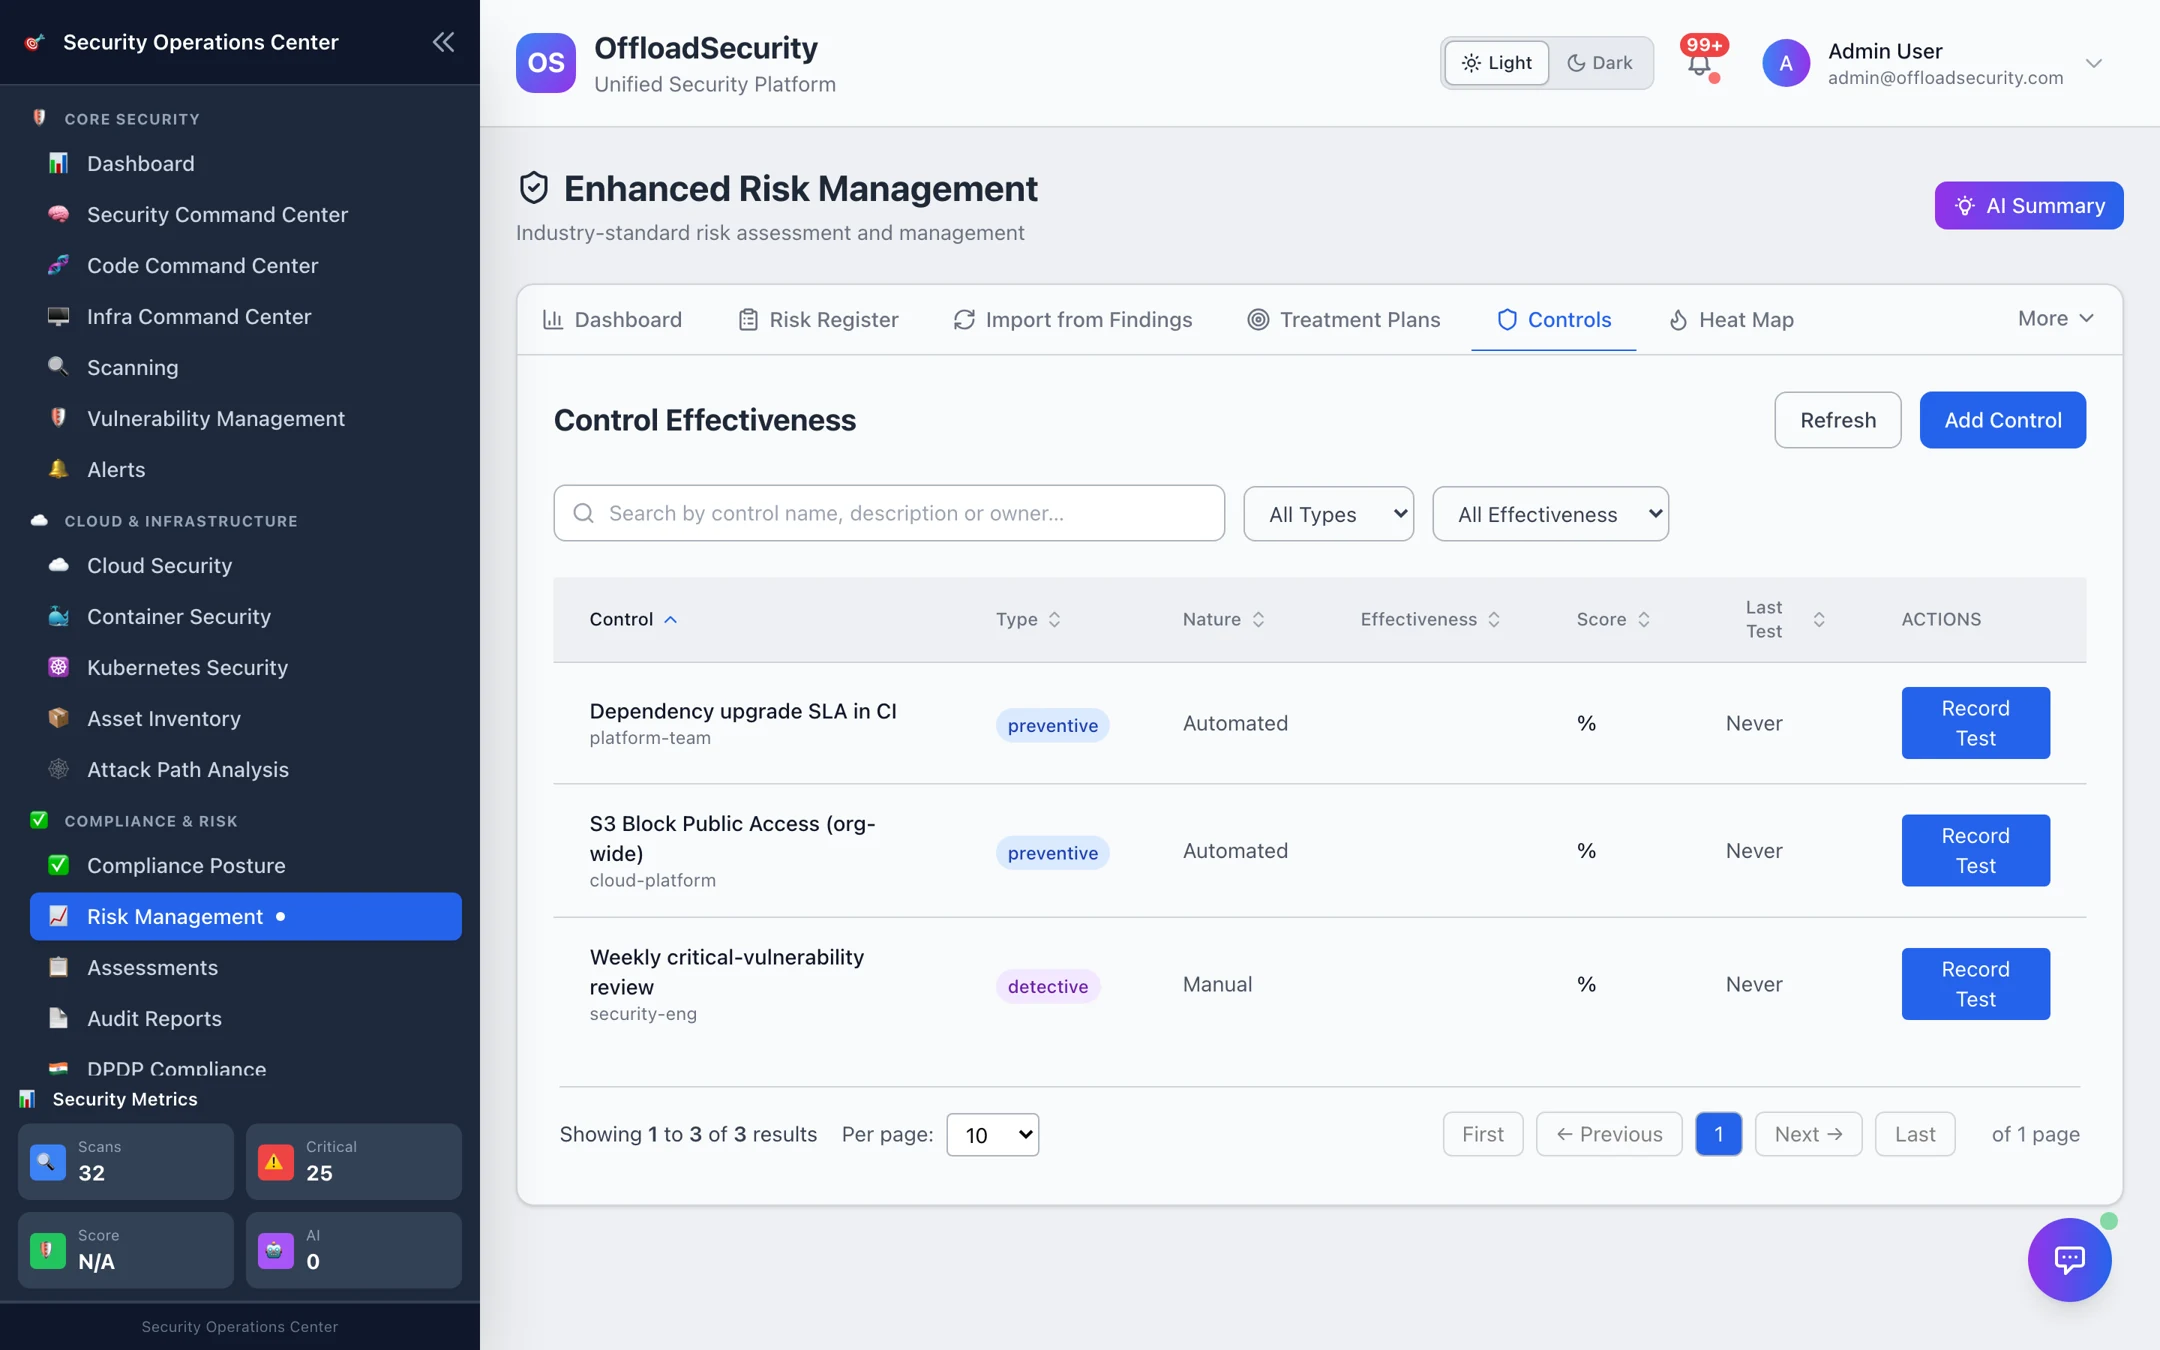
A control is anything that stops, catches or corrects a risk event. Define it with a type (preventive · detective · corrective · directive), a nature (manual · automated · hybrid), an owner, the risks it is linked to, and how much of the inherent risk it is designed to remove (inherent risk reduction %).
Then test it. Record Test captures the tester, test type (design, operating or both), procedure, sample size, exceptions found and the result: effective, partially effective, ineffective or not tested. Design and operating effectiveness roll up to an overall effectiveness and a 0–100 score.
Why testing matters — residual risk
Residual risk is not a number you type. For a risk without a completed treatment plan, the platform takes its inherent score and subtracts each linked control's inherent risk reduction weighted by its tested effectiveness — effective counts fully, partially effective at half, ineffective and not tested at zero. An untested control reduces nothing; that is deliberate, and it is what the Inherent vs Residual panel on the Dashboard shows per risk.
Sort controls by inherent risk reduction and test those first — an org-wide S3 Block Public Access SCP marked effective moves several risks' residual scores at once.
Heat map
Where: Risk Management → Heat Map.
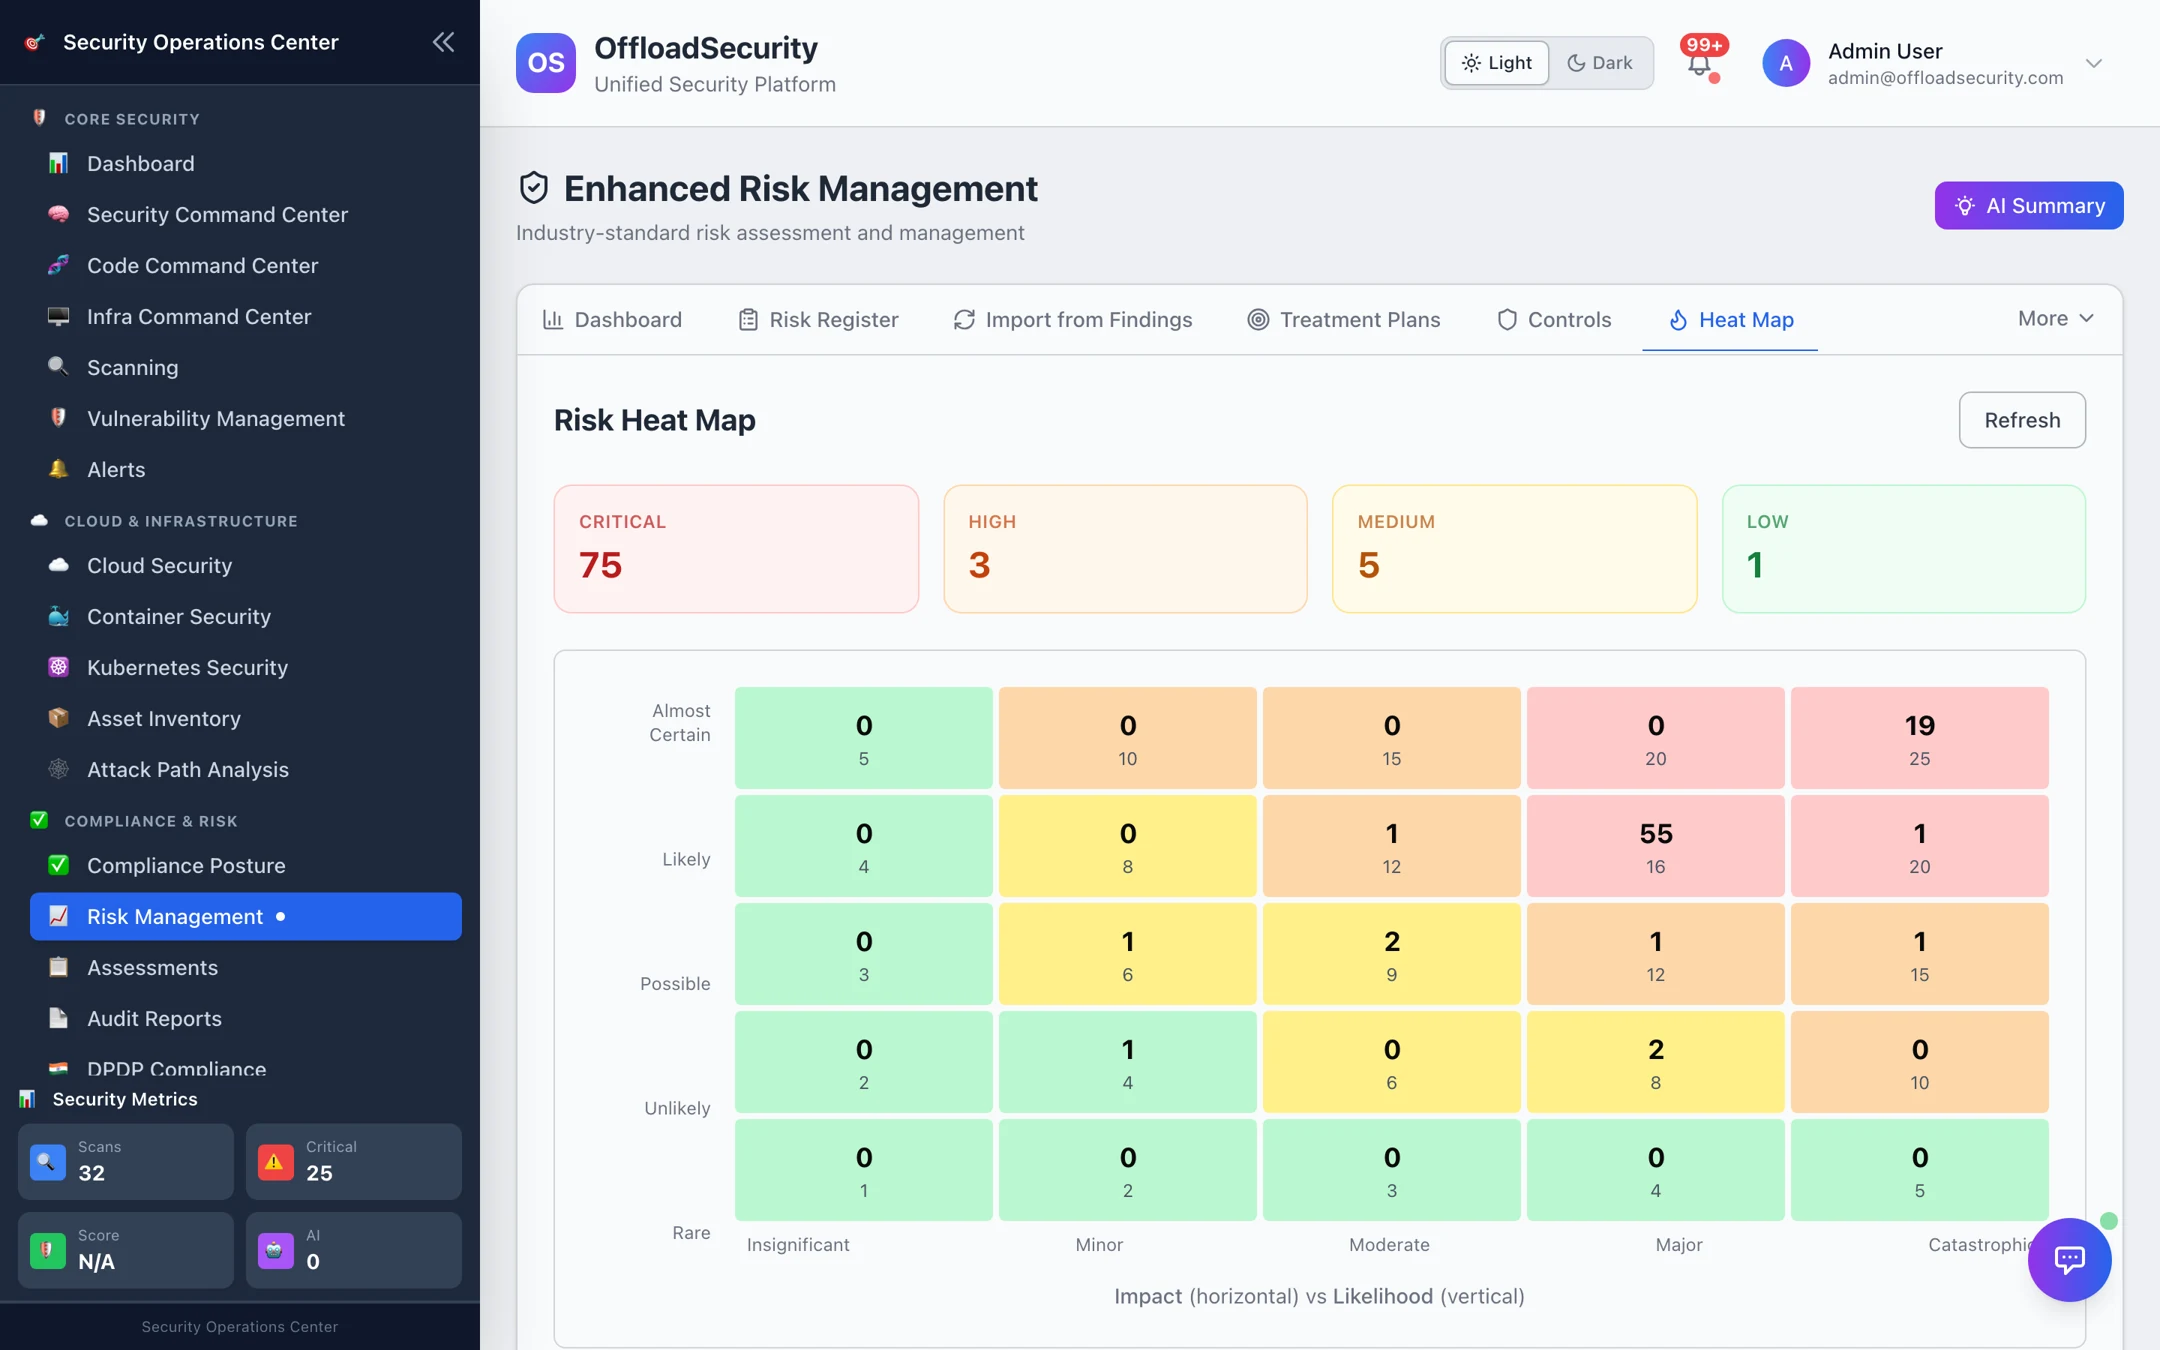
The 5 × 5 matrix places every business-scored risk by likelihood (rare → almost certain) and impact (insignificant → catastrophic); cells are coloured by the resulting level and show the risk count. Heat Map Export downloads the data for a slide. The Dashboard's Risk Appetite overlay draws your tolerance thresholds on the same grid — see Appetite, KRIs & Scenarios.
Related
- Risk Register — the risks these plans and controls belong to.
- Compliance Dashboard — control effectiveness feeds the framework view.
- Vulnerabilities & Risk API — treatment plans, actions, approvals, controls and tests over REST.