Vulnerability Dashboard
Where: Vulnerability Management → Dashboard.
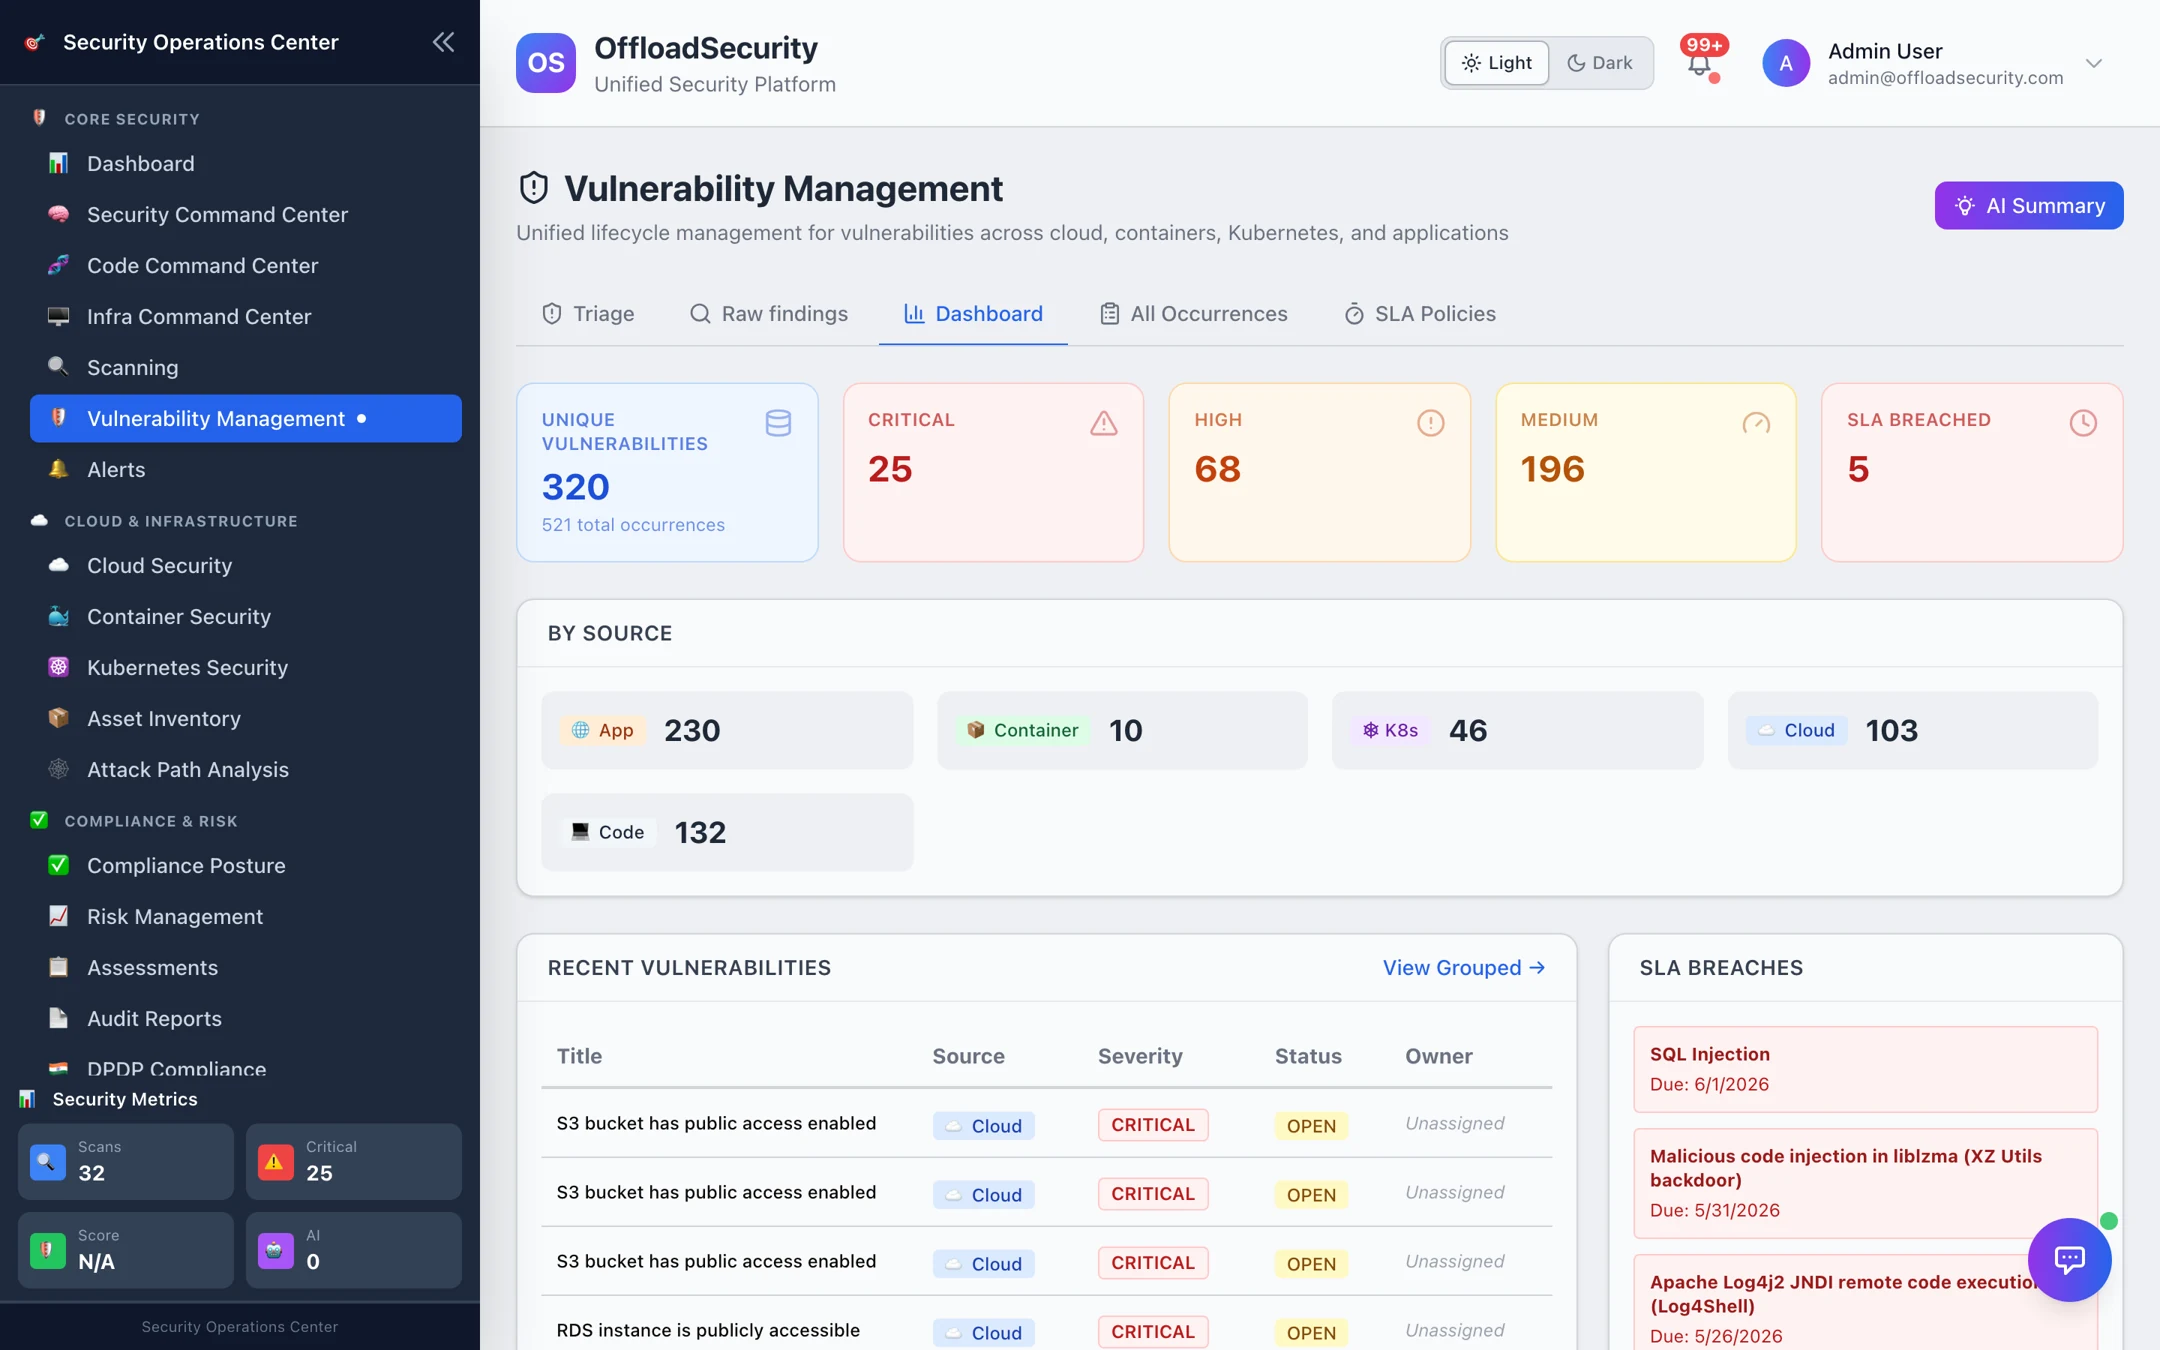
| Panel | What it shows | Use it for |
|---|---|---|
| Unique Vulnerabilities | Distinct vulnerabilities across all assets (not occurrences) | The honest size of the problem — one CVE on 40 images counts once |
| Critical / High / Medium | Unique vulnerabilities per severity | Trend week over week; the criticals number should only go down |
| SLA Breached | Occurrences past their SLA due date | Anything above zero is a conversation with an owner today |
| By Source | Unique counts per module — App, Container, K8s, Cloud, Code | Which scanner is generating the load, and where coverage may be thin |
| Recent Vulnerabilities | Newest arrivals with source, severity, status and owner | What changed since yesterday; select View Grouped to work them |
| SLA Breaches | The breached occurrences with due dates | Straight into the escalation conversation |
The dashboard reads the same unified data as the other tabs, so a decision made in the Triage queue is reflected here immediately. AI Summary (top right) narrates the current state in a paragraph for a stand-up or a status mail.
What good looks like
Unique criticals trending down, SLA Breached at zero, and Recent Vulnerabilities dominated by medium/low. If criticals are flat while total unique counts climb, scanning coverage is growing faster than remediation — look at the Triage queue's Untriaged count and the Risk Register for accepted items that should be fixed instead.
Related
- Triage Queue — act on what the dashboard shows.
- SLA Management — the policies behind the breach counts.
- Reports & AI — scheduled executive reports built on the same numbers.